29
/
en
AIzaSyAYiBZKx7MnpbEhh9jyipgxe19OcubqV5w
April 1, 2024
207658
Netherlands
NLD
true
2
1
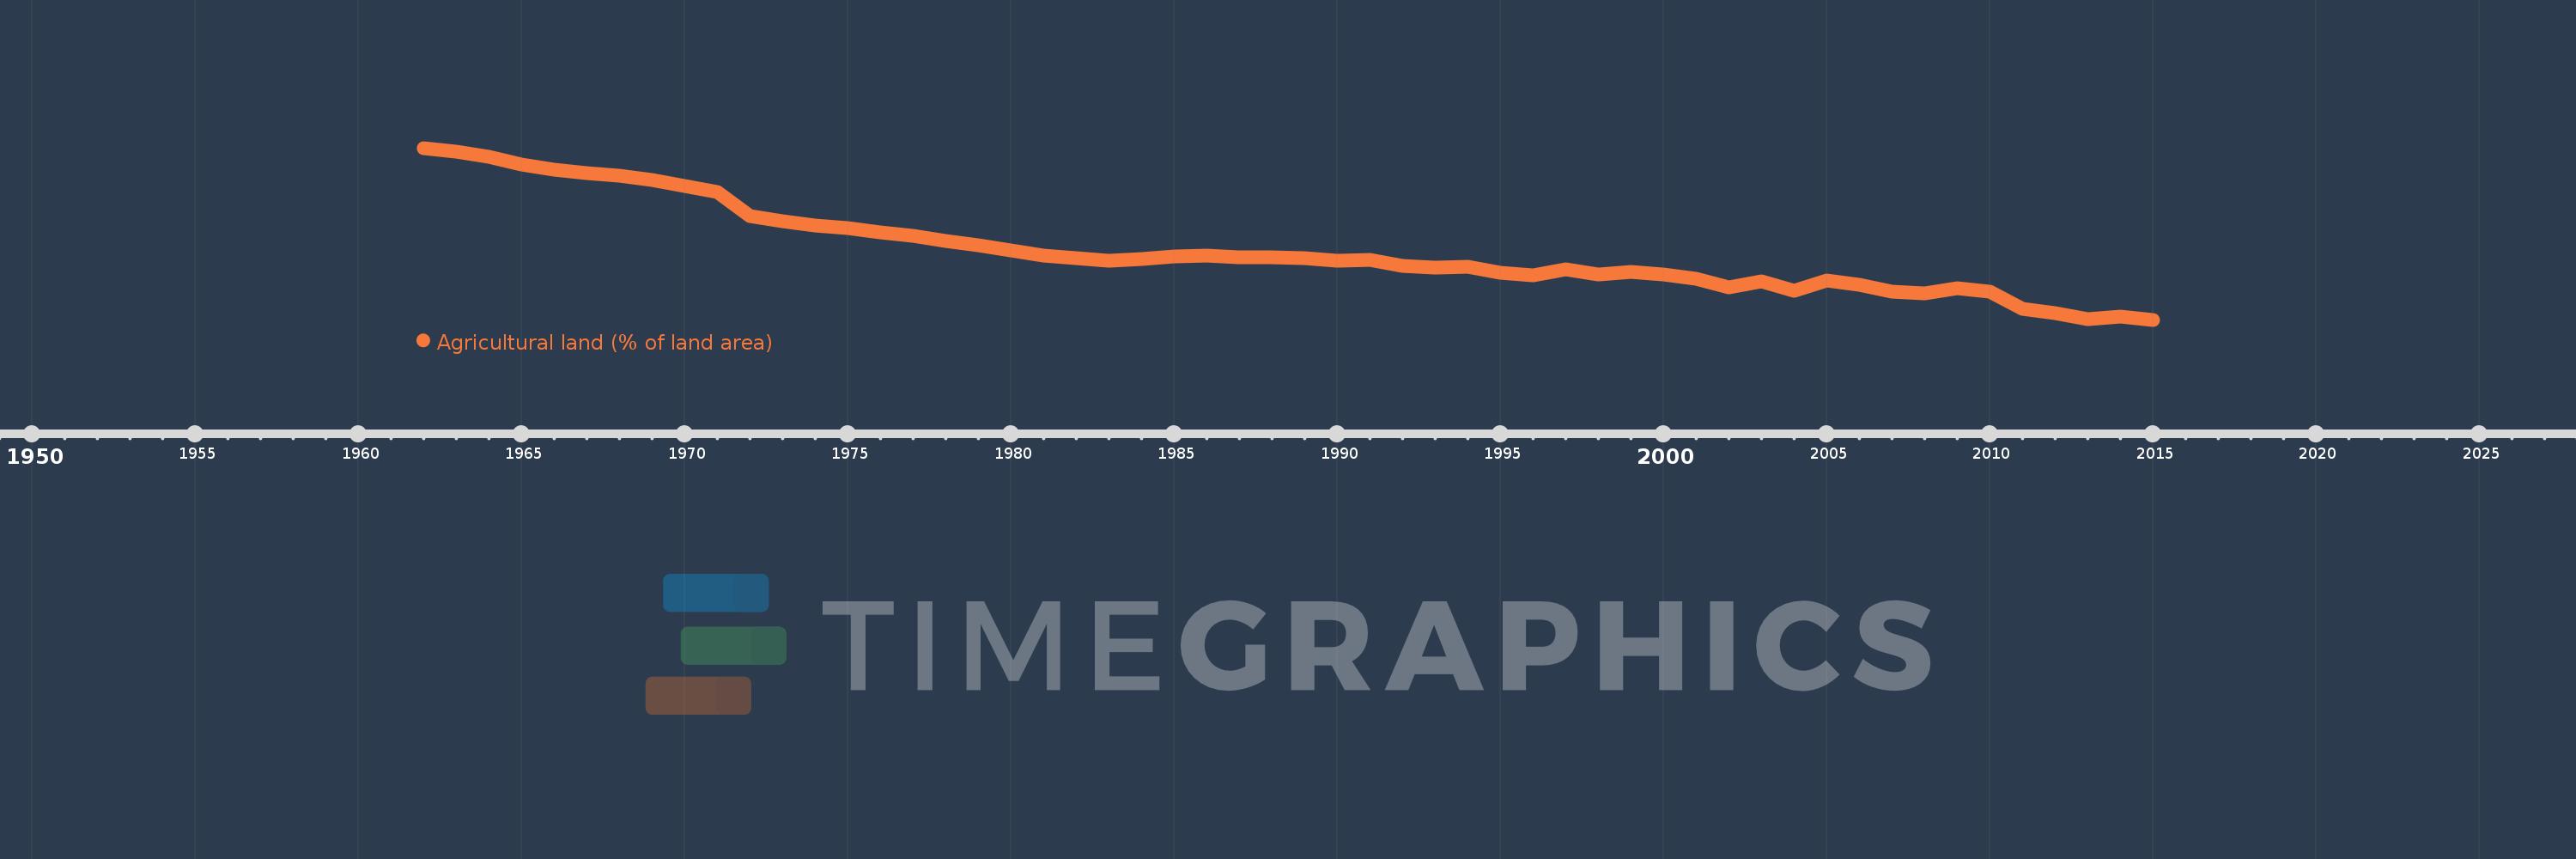
Agricultural land (% of land area)
2015,2014,2013,2012,2011,2010,2009,2008,2007,2006,2005,2004,2003,2002,2001,2000,1999,1998,1997,1996,1995,1994,1993,1992,1991,1990,1989,1988,1987,1986,1985,1984,1983,1982,1981,1980,1979,1978,1977,1976,1975,1974,1973,1972,1971,1970,1969,1968,1967,1966,1965,1964,1963,1962
This statistics in other country:
AfghanistanAlbaniaAlgeriaAmerican SamoaAndorraAngolaAntigua and BarbudaArab WorldArgentinaArmeniaArubaAustraliaAustriaAzerbaijanBahamas, TheBahrainBangladeshBarbadosBelarusBelgiumBelizeBeninBermudaBhutanBoliviaBosnia and HerzegovinaBotswanaBrazilBritish Virgin IslandsBrunei DarussalamBulgariaBurkina FasoBurundiCabo VerdeCambodiaCameroonCanadaCaribbean small statesCayman IslandsCentral African RepublicCentral Europe and the BalticsChadChannel IslandsChileChinaColombiaComorosCongo, Dem. Rep.Congo, Rep.Costa RicaCote d'IvoireCroatiaCubaCyprusCzech RepublicDenmarkDjiboutiDominicaDominican RepublicEarly-demographic dividendEast Asia & PacificEast Asia & Pacific (excluding high income)East Asia & Pacific (IDA & IBRD countries)EcuadorEgypt, Arab Rep.El SalvadorEquatorial GuineaEritreaEstoniaEthiopiaEuro areaEurope & Central AsiaEurope & Central Asia (excluding high income)Europe & Central Asia (IDA & IBRD countries)European UnionFaroe IslandsFijiFinlandFragile and conflict affected situationsFranceFrench PolynesiaGabonGambia, TheGeorgiaGermanyGhanaGreeceGreenlandGrenadaGuamGuatemalaGuineaGuinea-BissauGuyanaHaitiHeavily indebted poor countries (HIPC)High incomeHondurasHong Kong SAR, ChinaHungaryIBRD onlyIcelandIDA & IBRD totalIDA blendIDA onlyIDA totalIndiaIndonesiaIran, Islamic Rep.IraqIrelandIsle of ManIsraelItalyJamaicaJapanJordanKazakhstanKenyaKiribatiKorea, Dem. People’s Rep.Korea, Rep.KosovoKuwaitKyrgyz RepublicLao PDRLate-demographic dividendLatin America & Caribbean Latin America & Caribbean (excluding high income)Latin America & the Caribbean (IDA & IBRD countries)LatviaLeast developed countries: UN classificationLebanonLesothoLiberiaLibyaLiechtensteinLithuaniaLow & middle incomeLow incomeLower middle incomeLuxembourgMacedonia, FYRMadagascarMalawiMalaysiaMaldivesMaliMaltaMarshall IslandsMauritaniaMauritiusMexicoMicronesia, Fed. Sts.Middle East & North AfricaMiddle East & North Africa (excluding high income)Middle East & North Africa (IDA & IBRD countries)Middle incomeMoldovaMongoliaMontenegroMoroccoMozambiqueMyanmarNamibiaNauruNepalNetherlandsNew CaledoniaNew ZealandNicaraguaNigerNigeriaNorth AmericaNorthern Mariana IslandsNorwayOECD membersOmanOther small statesPacific island small statesPakistanPalauPanamaPapua New GuineaParaguayPeruPhilippinesPolandPortugalPost-demographic dividendPre-demographic dividendPuerto RicoQatarRomaniaRussian FederationRwandaSamoaSan MarinoSao Tome and PrincipeSaudi ArabiaSenegalSerbiaSeychellesSierra LeoneSingaporeSlovak RepublicSloveniaSmall statesSolomon IslandsSomaliaSouth AfricaSouth AsiaSouth Asia (IDA & IBRD)SpainSri LankaSt. Kitts and NevisSt. LuciaSt. Vincent and the GrenadinesSub-Saharan Africa Sub-Saharan Africa (excluding high income)Sub-Saharan Africa (IDA & IBRD countries)SudanSurinameSwazilandSwedenSwitzerlandSyrian Arab RepublicTajikistanTanzaniaThailandTimor-LesteTogoTongaTrinidad and TobagoTunisiaTurkeyTurkmenistanTurks and Caicos IslandsTuvaluUgandaUkraineUnited Arab EmiratesUnited KingdomUnited StatesUpper middle incomeUruguayUzbekistanVanuatuVenezuela, RBVietnamVirgin Islands (U.S.)West Bank and GazaWorldYemen, Rep.ZambiaZimbabwe Timeline:
This timeline shows a graph from 1962 to 2015 of Netherlands. No data until 1961. Number of actual observations by date: 54.
Source name:
World Development Indicators
Source organization:
Food and Agriculture Organization, electronic files and web site.
Categories, topics:
Agriculture & Rural Development, Climate Change, Environment
Last updated:
apr 23, 2017
Indicators value changes by year
Minimum:
54.589
jan 1, 2015
Maximum:
68.543
jan 1, 1962
At the date of observation
Value
Absolute change
Change from previous value
jan 1, 1962
68.543
+68.543
0.0%
jan 1, 1963
68.217
-0.326
-0.48%
jan 1, 1964
67.802
-0.415
-0.61%
jan 1, 1965
67.18
-0.622
-0.92%
jan 1, 1966
66.795
-0.385
-0.57%
jan 1, 1967
66.499
-0.296
-0.44%
jan 1, 1968
66.321
-0.178
-0.27%
jan 1, 1969
65.966
-0.355
-0.54%
jan 1, 1970
65.462
-0.504
-0.76%
jan 1, 1971
64.959
-0.504
-0.77%
jan 1, 1972
63.033
-1.925
-2.96%
jan 1, 1973
62.618
-0.415
-0.66%
jan 1, 1974
62.233
-0.385
-0.61%
jan 1, 1975
62.026
-0.207
-0.33%
jan 1, 1976
61.671
-0.355
-0.57%
jan 1, 1977
61.404
-0.267
-0.43%
jan 1, 1978
61.019
-0.385
-0.63%
jan 1, 1979
60.604
-0.415
-0.68%
jan 1, 1980
60.249
-0.355
-0.59%
jan 1, 1981
59.834
-0.415
-0.69%
jan 1, 1982
59.568
-0.267
-0.45%
jan 1, 1983
59.39
-0.178
-0.3%
jan 1, 1984
59.508
+0.118
0.2%
jan 1, 1985
59.716
+0.207
0.35%
jan 1, 1986
59.805
+0.089
0.15%
jan 1, 1987
59.686
-0.118
-0.2%
jan 1, 1988
59.656
-0.03
-0.05%
jan 1, 1989
59.597
-0.059
-0.1%
jan 1, 1990
59.36
-0.237
-0.4%
jan 1, 1991
59.419
+0.059
0.1%
jan 1, 1992
58.975
-0.444
-0.75%
jan 1, 1993
58.827
-0.148
-0.25%
jan 1, 1994
58.886
+0.059
0.1%
jan 1, 1995
58.383
-0.504
-0.86%
jan 1, 1996
58.175
-0.207
-0.36%
jan 1, 1997
58.679
+0.504
0.87%
jan 1, 1998
58.235
-0.444
-0.76%
jan 1, 1999
58.442
+0.207
0.36%
jan 1, 2000
58.264
-0.178
-0.3%
jan 1, 2001
57.938
-0.326
-0.56%
jan 1, 2002
57.198
-0.741
-1.28%
jan 1, 2003
57.731
+0.533
0.93%
jan 1, 2004
56.961
-0.77
-1.33%
jan 1, 2005
57.743
+0.782
1.37%
jan 1, 2006
57.396
-0.347
-0.6%
jan 1, 2007
56.86
-0.536
-0.93%
jan 1, 2008
56.706
-0.154
-0.27%
jan 1, 2009
57.148
+0.441
0.78%
jan 1, 2010
56.846
-0.302
-0.53%
jan 1, 2011
55.508
-1.337
-2.35%
jan 1, 2012
55.113
-0.396
-0.71%
jan 1, 2013
54.617
-0.495
-0.9%
jan 1, 2014
54.841
+0.224
0.41%
jan 1, 2015
54.589
-0.252
-0.46%
Ranking of countries by current statistics by years


Comments: