29
/
en
AIzaSyAYiBZKx7MnpbEhh9jyipgxe19OcubqV5w
April 1, 2024
219284
Papua New Guinea
PNG
true
2
1
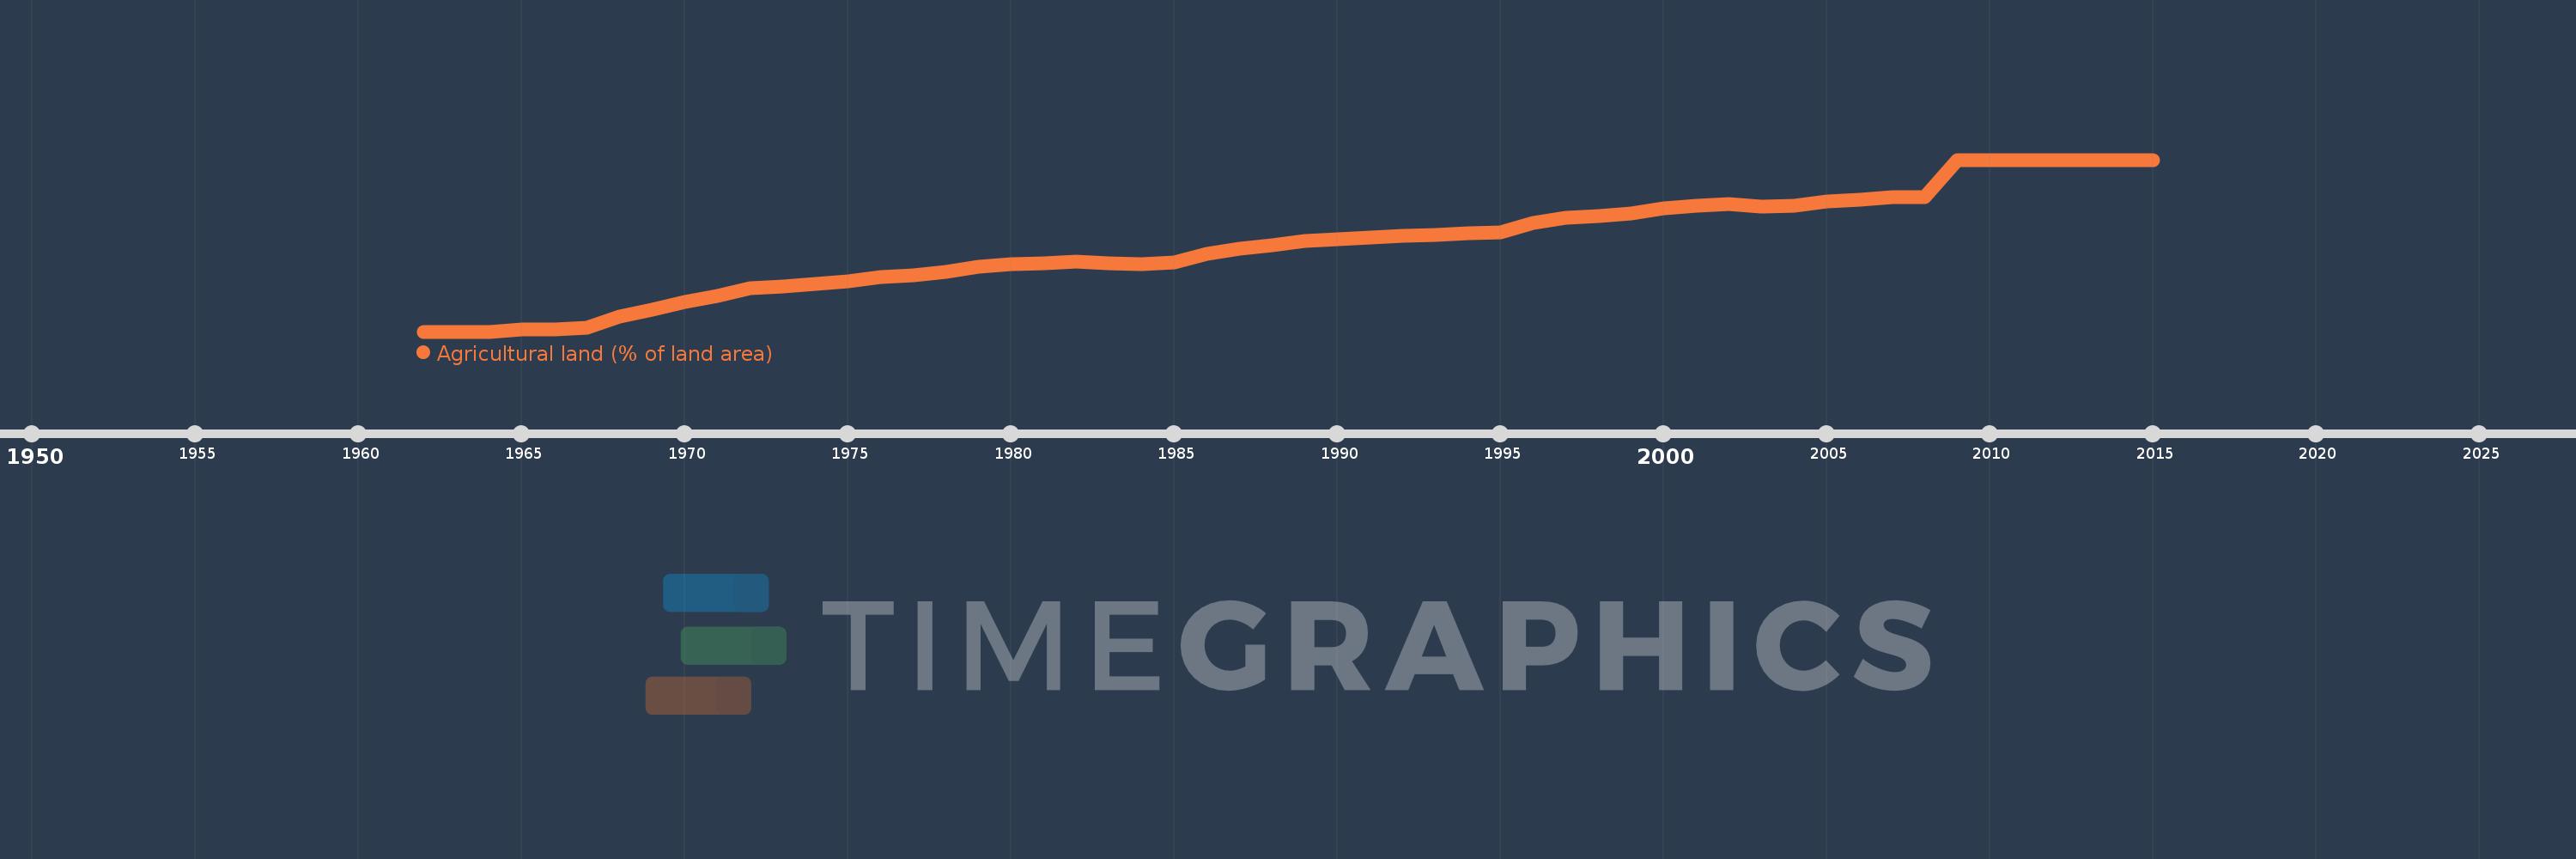
Agricultural land (% of land area)
2015,2014,2013,2012,2011,2010,2009,2008,2007,2006,2005,2004,2003,2002,2001,2000,1999,1998,1997,1996,1995,1994,1993,1992,1991,1990,1989,1988,1987,1986,1985,1984,1983,1982,1981,1980,1979,1978,1977,1976,1975,1974,1973,1972,1971,1970,1969,1968,1967,1966,1965,1964,1963,1962
This statistics in other country:
AfghanistanAlbaniaAlgeriaAmerican SamoaAndorraAngolaAntigua and BarbudaArab WorldArgentinaArmeniaArubaAustraliaAustriaAzerbaijanBahamas, TheBahrainBangladeshBarbadosBelarusBelgiumBelizeBeninBermudaBhutanBoliviaBosnia and HerzegovinaBotswanaBrazilBritish Virgin IslandsBrunei DarussalamBulgariaBurkina FasoBurundiCabo VerdeCambodiaCameroonCanadaCaribbean small statesCayman IslandsCentral African RepublicCentral Europe and the BalticsChadChannel IslandsChileChinaColombiaComorosCongo, Dem. Rep.Congo, Rep.Costa RicaCote d'IvoireCroatiaCubaCyprusCzech RepublicDenmarkDjiboutiDominicaDominican RepublicEarly-demographic dividendEast Asia & PacificEast Asia & Pacific (excluding high income)East Asia & Pacific (IDA & IBRD countries)EcuadorEgypt, Arab Rep.El SalvadorEquatorial GuineaEritreaEstoniaEthiopiaEuro areaEurope & Central AsiaEurope & Central Asia (excluding high income)Europe & Central Asia (IDA & IBRD countries)European UnionFaroe IslandsFijiFinlandFragile and conflict affected situationsFranceFrench PolynesiaGabonGambia, TheGeorgiaGermanyGhanaGreeceGreenlandGrenadaGuamGuatemalaGuineaGuinea-BissauGuyanaHaitiHeavily indebted poor countries (HIPC)High incomeHondurasHong Kong SAR, ChinaHungaryIBRD onlyIcelandIDA & IBRD totalIDA blendIDA onlyIDA totalIndiaIndonesiaIran, Islamic Rep.IraqIrelandIsle of ManIsraelItalyJamaicaJapanJordanKazakhstanKenyaKiribatiKorea, Dem. People’s Rep.Korea, Rep.KosovoKuwaitKyrgyz RepublicLao PDRLate-demographic dividendLatin America & Caribbean Latin America & Caribbean (excluding high income)Latin America & the Caribbean (IDA & IBRD countries)LatviaLeast developed countries: UN classificationLebanonLesothoLiberiaLibyaLiechtensteinLithuaniaLow & middle incomeLow incomeLower middle incomeLuxembourgMacedonia, FYRMadagascarMalawiMalaysiaMaldivesMaliMaltaMarshall IslandsMauritaniaMauritiusMexicoMicronesia, Fed. Sts.Middle East & North AfricaMiddle East & North Africa (excluding high income)Middle East & North Africa (IDA & IBRD countries)Middle incomeMoldovaMongoliaMontenegroMoroccoMozambiqueMyanmarNamibiaNauruNepalNetherlandsNew CaledoniaNew ZealandNicaraguaNigerNigeriaNorth AmericaNorthern Mariana IslandsNorwayOECD membersOmanOther small statesPacific island small statesPakistanPalauPanamaPapua New GuineaParaguayPeruPhilippinesPolandPortugalPost-demographic dividendPre-demographic dividendPuerto RicoQatarRomaniaRussian FederationRwandaSamoaSan MarinoSao Tome and PrincipeSaudi ArabiaSenegalSerbiaSeychellesSierra LeoneSingaporeSlovak RepublicSloveniaSmall statesSolomon IslandsSomaliaSouth AfricaSouth AsiaSouth Asia (IDA & IBRD)SpainSri LankaSt. Kitts and NevisSt. LuciaSt. Vincent and the GrenadinesSub-Saharan Africa Sub-Saharan Africa (excluding high income)Sub-Saharan Africa (IDA & IBRD countries)SudanSurinameSwazilandSwedenSwitzerlandSyrian Arab RepublicTajikistanTanzaniaThailandTimor-LesteTogoTongaTrinidad and TobagoTunisiaTurkeyTurkmenistanTurks and Caicos IslandsTuvaluUgandaUkraineUnited Arab EmiratesUnited KingdomUnited StatesUpper middle incomeUruguayUzbekistanVanuatuVenezuela, RBVietnamVirgin Islands (U.S.)West Bank and GazaWorldYemen, Rep.ZambiaZimbabwe Timeline:
This timeline shows a graph from 1962 to 2015 of Papua New Guinea. No data until 1961. Number of actual observations by date: 54.
Source name:
World Development Indicators
Source organization:
Food and Agriculture Organization, electronic files and web site.
Categories, topics:
Agriculture & Rural Development, Climate Change, Environment
Last updated:
apr 23, 2017
Indicators value changes by year
At the date of observation
Value
Absolute change
Change from previous value
jan 1, 1962
1.093
+1.093
0.0%
jan 1, 1963
1.093
0.0
0.0%
jan 1, 1964
1.093
0.0
0.0%
jan 1, 1965
1.115
+0.022
2.02%
jan 1, 1966
1.115
0.0
0.0%
jan 1, 1967
1.128
+0.013
1.19%
jan 1, 1968
1.228
+0.099
8.81%
jan 1, 1969
1.292
+0.064
5.22%
jan 1, 1970
1.36
+0.068
5.3%
jan 1, 1971
1.415
+0.055
4.06%
jan 1, 1972
1.477
+0.062
4.37%
jan 1, 1973
1.499
+0.022
1.49%
jan 1, 1974
1.521
+0.022
1.47%
jan 1, 1975
1.541
+0.02
1.31%
jan 1, 1976
1.577
+0.035
2.29%
jan 1, 1977
1.599
+0.022
1.4%
jan 1, 1978
1.623
+0.024
1.52%
jan 1, 1979
1.669
+0.046
2.86%
jan 1, 1980
1.696
+0.026
1.59%
jan 1, 1981
1.705
+0.009
0.52%
jan 1, 1982
1.718
+0.013
0.78%
jan 1, 1983
1.7
-0.018
-1.03%
jan 1, 1984
1.694
-0.007
-0.39%
jan 1, 1985
1.711
+0.018
1.04%
jan 1, 1986
1.784
+0.073
4.26%
jan 1, 1987
1.833
+0.049
2.72%
jan 1, 1988
1.868
+0.035
1.93%
jan 1, 1989
1.906
+0.038
2.01%
jan 1, 1990
1.921
+0.015
0.81%
jan 1, 1991
1.937
+0.015
0.8%
jan 1, 1992
1.948
+0.011
0.57%
jan 1, 1993
1.959
+0.011
0.57%
jan 1, 1994
1.972
+0.013
0.68%
jan 1, 1995
1.983
+0.011
0.56%
jan 1, 1996
2.062
+0.079
4.01%
jan 1, 1997
2.109
+0.046
2.25%
jan 1, 1998
2.124
+0.015
0.73%
jan 1, 1999
2.151
+0.026
1.25%
jan 1, 2000
2.193
+0.042
1.95%
jan 1, 2001
2.219
+0.026
1.21%
jan 1, 2002
2.23
+0.011
0.5%
jan 1, 2003
2.208
-0.022
-0.99%
jan 1, 2004
2.219
+0.011
0.5%
jan 1, 2005
2.252
+0.033
1.49%
jan 1, 2006
2.274
+0.022
0.98%
jan 1, 2007
2.297
+0.022
0.97%
jan 1, 2008
2.297
0.0
0.0%
jan 1, 2009
2.628
+0.331
14.42%
jan 1, 2010
2.628
0.0
0.0%
jan 1, 2011
2.628
0.0
0.0%
jan 1, 2012
2.628
0.0
0.0%
jan 1, 2013
2.628
0.0
0.0%
jan 1, 2014
2.628
0.0
0.0%
jan 1, 2015
2.628
0.0
0.0%
Ranking of countries by current statistics by years


Comments: