29
/
en
AIzaSyAYiBZKx7MnpbEhh9jyipgxe19OcubqV5w
April 1, 2024
252674
Sudan
SDN
true
2
1
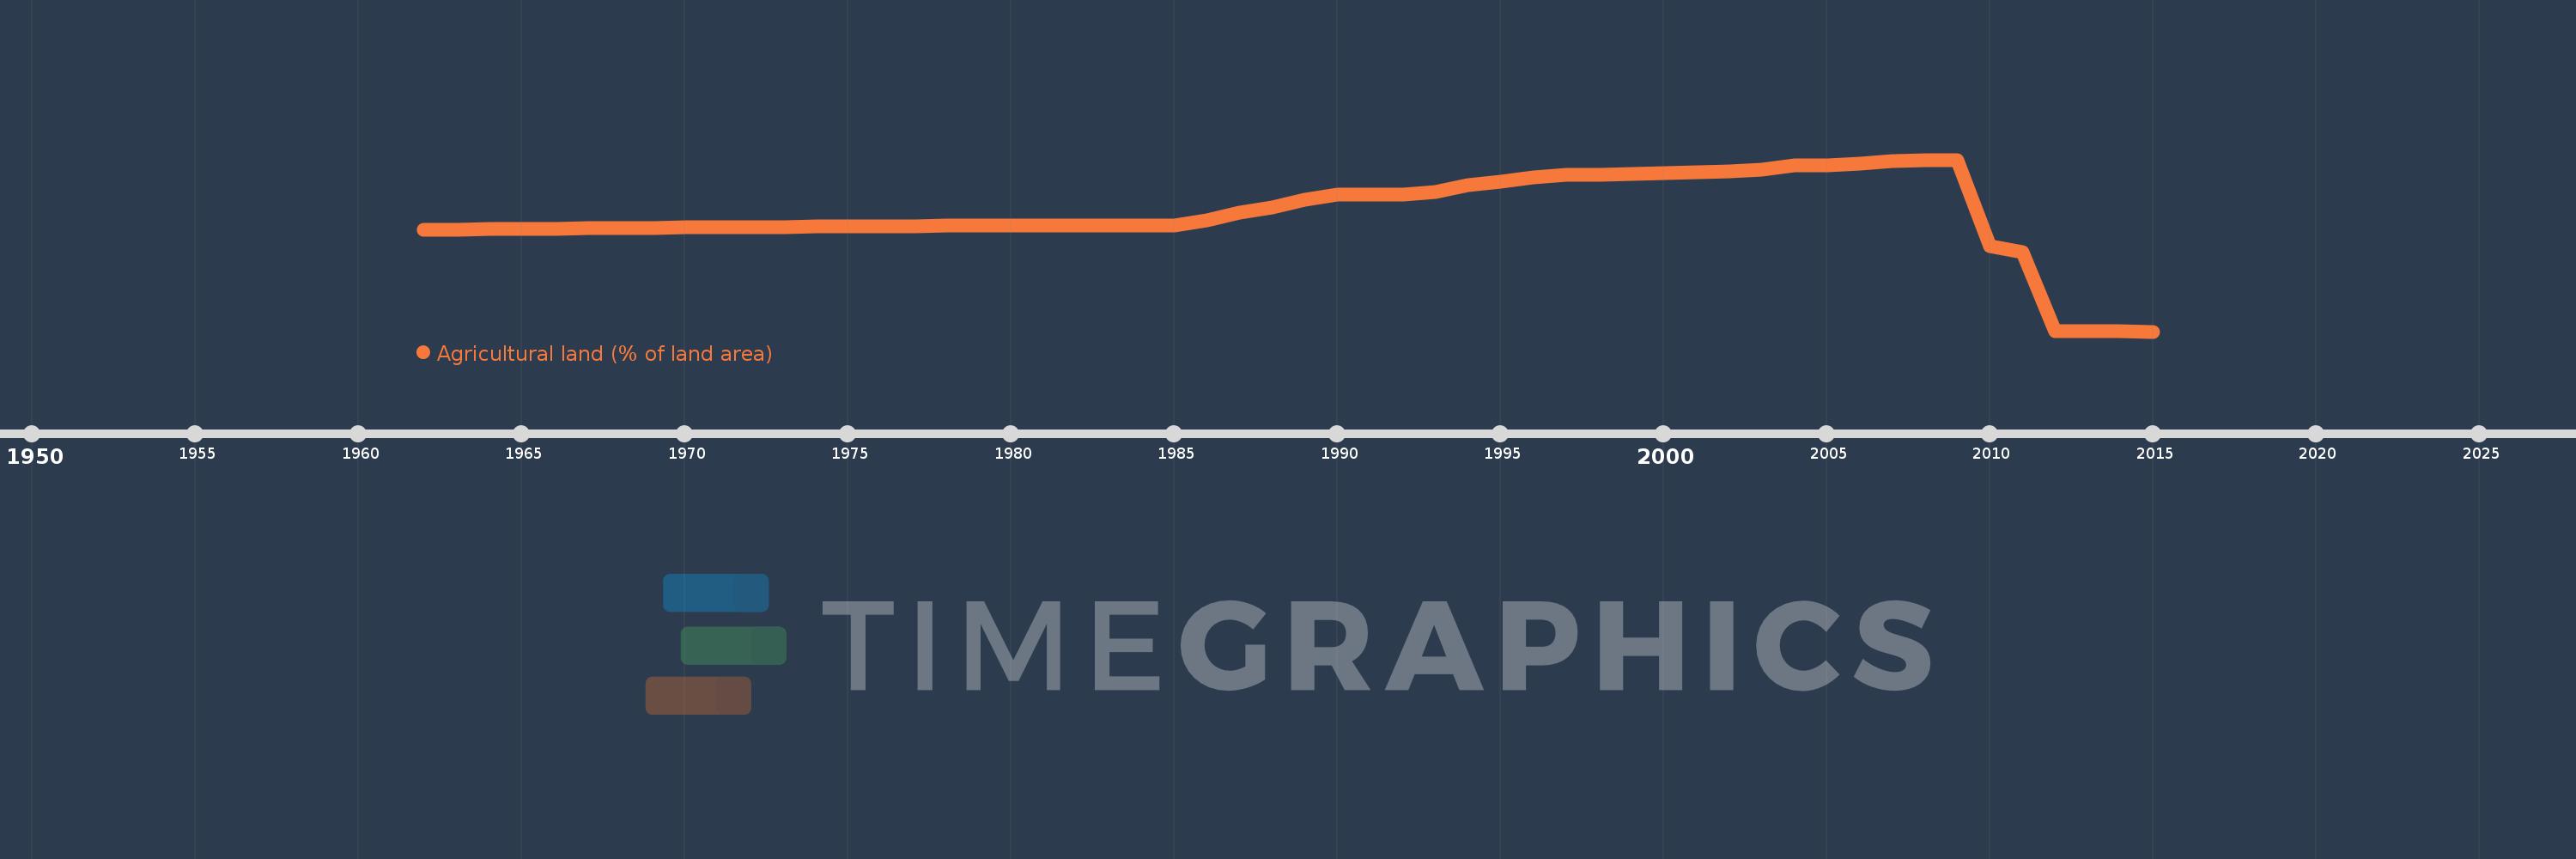
Agricultural land (% of land area)
2015,2014,2013,2012,2011,2010,2009,2008,2007,2006,2005,2004,2003,2002,2001,2000,1999,1998,1997,1996,1995,1994,1993,1992,1991,1990,1989,1988,1987,1986,1985,1984,1983,1982,1981,1980,1979,1978,1977,1976,1975,1974,1973,1972,1971,1970,1969,1968,1967,1966,1965,1964,1963,1962
This statistics in other country:
AfghanistanAlbaniaAlgeriaAmerican SamoaAndorraAngolaAntigua and BarbudaArab WorldArgentinaArmeniaArubaAustraliaAustriaAzerbaijanBahamas, TheBahrainBangladeshBarbadosBelarusBelgiumBelizeBeninBermudaBhutanBoliviaBosnia and HerzegovinaBotswanaBrazilBritish Virgin IslandsBrunei DarussalamBulgariaBurkina FasoBurundiCabo VerdeCambodiaCameroonCanadaCaribbean small statesCayman IslandsCentral African RepublicCentral Europe and the BalticsChadChannel IslandsChileChinaColombiaComorosCongo, Dem. Rep.Congo, Rep.Costa RicaCote d'IvoireCroatiaCubaCyprusCzech RepublicDenmarkDjiboutiDominicaDominican RepublicEarly-demographic dividendEast Asia & PacificEast Asia & Pacific (excluding high income)East Asia & Pacific (IDA & IBRD countries)EcuadorEgypt, Arab Rep.El SalvadorEquatorial GuineaEritreaEstoniaEthiopiaEuro areaEurope & Central AsiaEurope & Central Asia (excluding high income)Europe & Central Asia (IDA & IBRD countries)European UnionFaroe IslandsFijiFinlandFragile and conflict affected situationsFranceFrench PolynesiaGabonGambia, TheGeorgiaGermanyGhanaGreeceGreenlandGrenadaGuamGuatemalaGuineaGuinea-BissauGuyanaHaitiHeavily indebted poor countries (HIPC)High incomeHondurasHong Kong SAR, ChinaHungaryIBRD onlyIcelandIDA & IBRD totalIDA blendIDA onlyIDA totalIndiaIndonesiaIran, Islamic Rep.IraqIrelandIsle of ManIsraelItalyJamaicaJapanJordanKazakhstanKenyaKiribatiKorea, Dem. People’s Rep.Korea, Rep.KosovoKuwaitKyrgyz RepublicLao PDRLate-demographic dividendLatin America & Caribbean Latin America & Caribbean (excluding high income)Latin America & the Caribbean (IDA & IBRD countries)LatviaLeast developed countries: UN classificationLebanonLesothoLiberiaLibyaLiechtensteinLithuaniaLow & middle incomeLow incomeLower middle incomeLuxembourgMacedonia, FYRMadagascarMalawiMalaysiaMaldivesMaliMaltaMarshall IslandsMauritaniaMauritiusMexicoMicronesia, Fed. Sts.Middle East & North AfricaMiddle East & North Africa (excluding high income)Middle East & North Africa (IDA & IBRD countries)Middle incomeMoldovaMongoliaMontenegroMoroccoMozambiqueMyanmarNamibiaNauruNepalNetherlandsNew CaledoniaNew ZealandNicaraguaNigerNigeriaNorth AmericaNorthern Mariana IslandsNorwayOECD membersOmanOther small statesPacific island small statesPakistanPalauPanamaPapua New GuineaParaguayPeruPhilippinesPolandPortugalPost-demographic dividendPre-demographic dividendPuerto RicoQatarRomaniaRussian FederationRwandaSamoaSan MarinoSao Tome and PrincipeSaudi ArabiaSenegalSerbiaSeychellesSierra LeoneSingaporeSlovak RepublicSloveniaSmall statesSolomon IslandsSomaliaSouth AfricaSouth AsiaSouth Asia (IDA & IBRD)SpainSri LankaSt. Kitts and NevisSt. LuciaSt. Vincent and the GrenadinesSub-Saharan Africa Sub-Saharan Africa (excluding high income)Sub-Saharan Africa (IDA & IBRD countries)SudanSurinameSwazilandSwedenSwitzerlandSyrian Arab RepublicTajikistanTanzaniaThailandTimor-LesteTogoTongaTrinidad and TobagoTunisiaTurkeyTurkmenistanTurks and Caicos IslandsTuvaluUgandaUkraineUnited Arab EmiratesUnited KingdomUnited StatesUpper middle incomeUruguayUzbekistanVanuatuVenezuela, RBVietnamVirgin Islands (U.S.)West Bank and GazaWorldYemen, Rep.ZambiaZimbabwe Timeline:
This timeline shows a graph from 1962 to 2015 of Sudan. No data until 1961. Number of actual observations by date: 54.
Source name:
World Development Indicators
Source organization:
Food and Agriculture Organization, electronic files and web site.
Categories, topics:
Agriculture & Rural Development, Climate Change, Environment
Last updated:
apr 23, 2017
Indicators value changes by year
Minimum:
28.698
jan 1, 2015
Maximum:
57.533
jan 1, 2009
At the date of observation
Value
Absolute change
Change from previous value
jan 1, 1962
45.808
+45.808
0.0%
jan 1, 1963
45.85
+0.042
0.09%
jan 1, 1964
45.892
+0.042
0.09%
jan 1, 1965
45.935
+0.043
0.09%
jan 1, 1966
45.977
+0.042
0.09%
jan 1, 1967
46.019
+0.041
0.09%
jan 1, 1968
46.065
+0.046
0.1%
jan 1, 1969
46.106
+0.041
0.09%
jan 1, 1970
46.148
+0.042
0.09%
jan 1, 1971
46.189
+0.041
0.09%
jan 1, 1972
46.23
+0.041
0.09%
jan 1, 1973
46.271
+0.041
0.09%
jan 1, 1974
46.316
+0.045
0.1%
jan 1, 1975
46.34
+0.024
0.05%
jan 1, 1976
46.383
+0.042
0.09%
jan 1, 1977
46.423
+0.04
0.09%
jan 1, 1978
46.464
+0.041
0.09%
jan 1, 1979
46.48
+0.016
0.03%
jan 1, 1980
46.479
0.0
0.0%
jan 1, 1981
46.486
+0.006
0.01%
jan 1, 1982
46.498
+0.013
0.03%
jan 1, 1983
46.524
+0.025
0.05%
jan 1, 1984
46.545
+0.021
0.05%
jan 1, 1985
46.568
+0.023
0.05%
jan 1, 1986
47.433
+0.865
1.86%
jan 1, 1987
48.716
+1.284
2.71%
jan 1, 1988
49.581
+0.865
1.78%
jan 1, 1989
50.861
+1.279
2.58%
jan 1, 1990
51.709
+0.848
1.67%
jan 1, 1991
51.73
+0.021
0.04%
jan 1, 1992
51.753
+0.023
0.04%
jan 1, 1993
52.195
+0.442
0.85%
jan 1, 1994
53.339
+1.144
2.19%
jan 1, 1995
53.92
+0.582
1.09%
jan 1, 1996
54.564
+0.644
1.19%
jan 1, 1997
54.941
+0.377
0.69%
jan 1, 1998
55.064
+0.123
0.22%
jan 1, 1999
55.178
+0.114
0.21%
jan 1, 2000
55.283
+0.105
0.19%
jan 1, 2001
55.377
+0.094
0.17%
jan 1, 2002
55.595
+0.218
0.39%
jan 1, 2003
55.814
+0.219
0.39%
jan 1, 2004
56.62
+0.806
1.44%
jan 1, 2005
56.606
-0.014
-0.02%
jan 1, 2006
56.911
+0.304
0.54%
jan 1, 2007
57.261
+0.351
0.62%
jan 1, 2008
57.498
+0.237
0.41%
jan 1, 2009
57.533
+0.035
0.06%
jan 1, 2010
43.062
-14.471
-25.15%
jan 1, 2011
42.096
-0.967
-2.24%
jan 1, 2012
28.708
-13.387
-31.8%
jan 1, 2013
28.707
-0.002
-0.01%
jan 1, 2014
28.701
-0.005
-0.02%
jan 1, 2015
28.698
-0.004
-0.01%
Ranking of countries by current statistics by years


Comments: