29
/
en
AIzaSyAYiBZKx7MnpbEhh9jyipgxe19OcubqV5w
April 1, 2024
27063
East Asia & Pacific
EAS
false
2
1
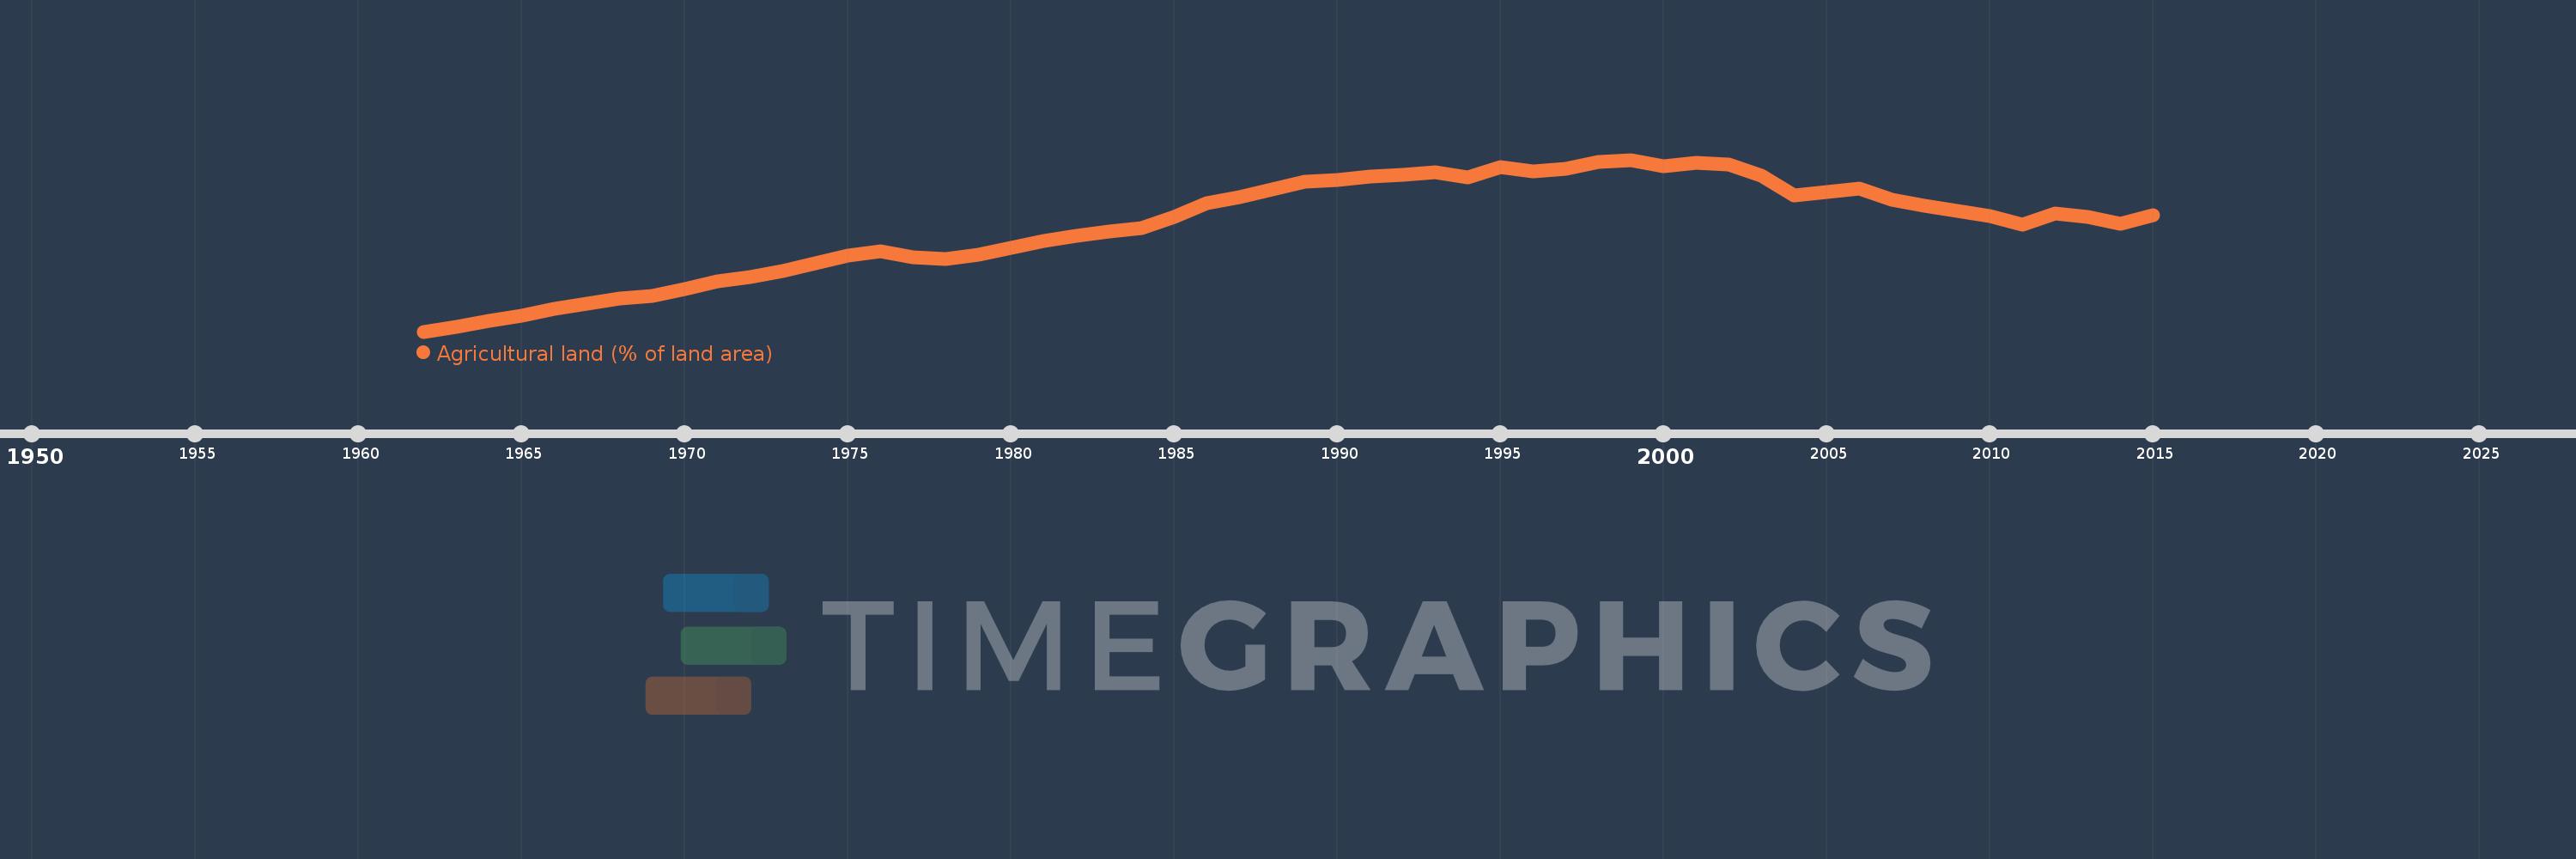
Agricultural land (% of land area)
2015,2014,2013,2012,2011,2010,2009,2008,2007,2006,2005,2004,2003,2002,2001,2000,1999,1998,1997,1996,1995,1994,1993,1992,1991,1990,1989,1988,1987,1986,1985,1984,1983,1982,1981,1980,1979,1978,1977,1976,1975,1974,1973,1972,1971,1970,1969,1968,1967,1966,1965,1964,1963,1962
This statistics in other country:
AfghanistanAlbaniaAlgeriaAmerican SamoaAndorraAngolaAntigua and BarbudaArab WorldArgentinaArmeniaArubaAustraliaAustriaAzerbaijanBahamas, TheBahrainBangladeshBarbadosBelarusBelgiumBelizeBeninBermudaBhutanBoliviaBosnia and HerzegovinaBotswanaBrazilBritish Virgin IslandsBrunei DarussalamBulgariaBurkina FasoBurundiCabo VerdeCambodiaCameroonCanadaCaribbean small statesCayman IslandsCentral African RepublicCentral Europe and the BalticsChadChannel IslandsChileChinaColombiaComorosCongo, Dem. Rep.Congo, Rep.Costa RicaCote d'IvoireCroatiaCubaCyprusCzech RepublicDenmarkDjiboutiDominicaDominican RepublicEarly-demographic dividendEast Asia & PacificEast Asia & Pacific (excluding high income)East Asia & Pacific (IDA & IBRD countries)EcuadorEgypt, Arab Rep.El SalvadorEquatorial GuineaEritreaEstoniaEthiopiaEuro areaEurope & Central AsiaEurope & Central Asia (excluding high income)Europe & Central Asia (IDA & IBRD countries)European UnionFaroe IslandsFijiFinlandFragile and conflict affected situationsFranceFrench PolynesiaGabonGambia, TheGeorgiaGermanyGhanaGreeceGreenlandGrenadaGuamGuatemalaGuineaGuinea-BissauGuyanaHaitiHeavily indebted poor countries (HIPC)High incomeHondurasHong Kong SAR, ChinaHungaryIBRD onlyIcelandIDA & IBRD totalIDA blendIDA onlyIDA totalIndiaIndonesiaIran, Islamic Rep.IraqIrelandIsle of ManIsraelItalyJamaicaJapanJordanKazakhstanKenyaKiribatiKorea, Dem. People’s Rep.Korea, Rep.KosovoKuwaitKyrgyz RepublicLao PDRLate-demographic dividendLatin America & Caribbean Latin America & Caribbean (excluding high income)Latin America & the Caribbean (IDA & IBRD countries)LatviaLeast developed countries: UN classificationLebanonLesothoLiberiaLibyaLiechtensteinLithuaniaLow & middle incomeLow incomeLower middle incomeLuxembourgMacedonia, FYRMadagascarMalawiMalaysiaMaldivesMaliMaltaMarshall IslandsMauritaniaMauritiusMexicoMicronesia, Fed. Sts.Middle East & North AfricaMiddle East & North Africa (excluding high income)Middle East & North Africa (IDA & IBRD countries)Middle incomeMoldovaMongoliaMontenegroMoroccoMozambiqueMyanmarNamibiaNauruNepalNetherlandsNew CaledoniaNew ZealandNicaraguaNigerNigeriaNorth AmericaNorthern Mariana IslandsNorwayOECD membersOmanOther small statesPacific island small statesPakistanPalauPanamaPapua New GuineaParaguayPeruPhilippinesPolandPortugalPost-demographic dividendPre-demographic dividendPuerto RicoQatarRomaniaRussian FederationRwandaSamoaSan MarinoSao Tome and PrincipeSaudi ArabiaSenegalSerbiaSeychellesSierra LeoneSingaporeSlovak RepublicSloveniaSmall statesSolomon IslandsSomaliaSouth AfricaSouth AsiaSouth Asia (IDA & IBRD)SpainSri LankaSt. Kitts and NevisSt. LuciaSt. Vincent and the GrenadinesSub-Saharan Africa Sub-Saharan Africa (excluding high income)Sub-Saharan Africa (IDA & IBRD countries)SudanSurinameSwazilandSwedenSwitzerlandSyrian Arab RepublicTajikistanTanzaniaThailandTimor-LesteTogoTongaTrinidad and TobagoTunisiaTurkeyTurkmenistanTurks and Caicos IslandsTuvaluUgandaUkraineUnited Arab EmiratesUnited KingdomUnited StatesUpper middle incomeUruguayUzbekistanVanuatuVenezuela, RBVietnamVirgin Islands (U.S.)West Bank and GazaWorldYemen, Rep.ZambiaZimbabwe Timeline:
This timeline shows a graph from 1962 to 2015 of East Asia & Pacific. No data until 1961. Number of actual observations by date: 54.
Source name:
World Development Indicators
Source organization:
Food and Agriculture Organization, electronic files and web site.
Categories, topics:
Agriculture & Rural Development, Climate Change, Environment
Last updated:
apr 23, 2017
Indicators value changes by year
Minimum:
43.331
jan 1, 1962
Maximum:
51.303
jan 1, 1999
At the date of observation
Value
Absolute change
Change from previous value
jan 1, 1962
43.331
+43.331
0.0%
jan 1, 1963
43.554
+0.223
0.52%
jan 1, 1964
43.81
+0.255
0.59%
jan 1, 1965
44.064
+0.255
0.58%
jan 1, 1966
44.399
+0.335
0.76%
jan 1, 1967
44.608
+0.209
0.47%
jan 1, 1968
44.884
+0.276
0.62%
jan 1, 1969
44.967
+0.083
0.18%
jan 1, 1970
45.317
+0.35
0.78%
jan 1, 1971
45.646
+0.329
0.73%
jan 1, 1972
45.857
+0.211
0.46%
jan 1, 1973
46.156
+0.299
0.65%
jan 1, 1974
46.516
+0.36
0.78%
jan 1, 1975
46.866
+0.35
0.75%
jan 1, 1976
47.061
+0.195
0.42%
jan 1, 1977
46.776
-0.285
-0.6%
jan 1, 1978
46.701
-0.075
-0.16%
jan 1, 1979
46.891
+0.19
0.41%
jan 1, 1980
47.22
+0.329
0.7%
jan 1, 1981
47.526
+0.306
0.65%
jan 1, 1982
47.779
+0.253
0.53%
jan 1, 1983
47.983
+0.204
0.43%
jan 1, 1984
48.152
+0.17
0.35%
jan 1, 1985
48.662
+0.51
1.06%
jan 1, 1986
49.282
+0.62
1.27%
jan 1, 1987
49.551
+0.269
0.55%
jan 1, 1988
49.928
+0.377
0.76%
jan 1, 1989
50.28
+0.352
0.7%
jan 1, 1990
50.361
+0.082
0.16%
jan 1, 1991
50.544
+0.183
0.36%
jan 1, 1992
50.594
+0.05
0.1%
jan 1, 1993
50.729
+0.135
0.27%
jan 1, 1994
50.491
-0.238
-0.47%
jan 1, 1995
50.982
+0.49
0.97%
jan 1, 1996
50.78
-0.201
-0.4%
jan 1, 1997
50.866
+0.086
0.17%
jan 1, 1998
51.21
+0.344
0.68%
jan 1, 1999
51.303
+0.093
0.18%
jan 1, 2000
51.011
-0.292
-0.57%
jan 1, 2001
51.173
+0.162
0.32%
jan 1, 2002
51.102
-0.07
-0.14%
jan 1, 2003
50.568
-0.535
-1.05%
jan 1, 2004
49.629
-0.939
-1.86%
jan 1, 2005
49.791
+0.162
0.33%
jan 1, 2006
49.984
+0.193
0.39%
jan 1, 2007
49.461
-0.524
-1.05%
jan 1, 2008
49.185
-0.275
-0.56%
jan 1, 2009
48.93
-0.256
-0.52%
jan 1, 2010
48.695
-0.235
-0.48%
jan 1, 2011
48.3
-0.395
-0.81%
jan 1, 2012
48.799
+0.499
1.03%
jan 1, 2013
48.663
-0.136
-0.28%
jan 1, 2014
48.331
-0.332
-0.68%
jan 1, 2015
48.715
+0.384
0.79%
Ranking of countries by current statistics by years


Comments: