29
/
en
AIzaSyAYiBZKx7MnpbEhh9jyipgxe19OcubqV5w
April 1, 2024
55307
Pre-demographic dividend
PRE
false
2
1
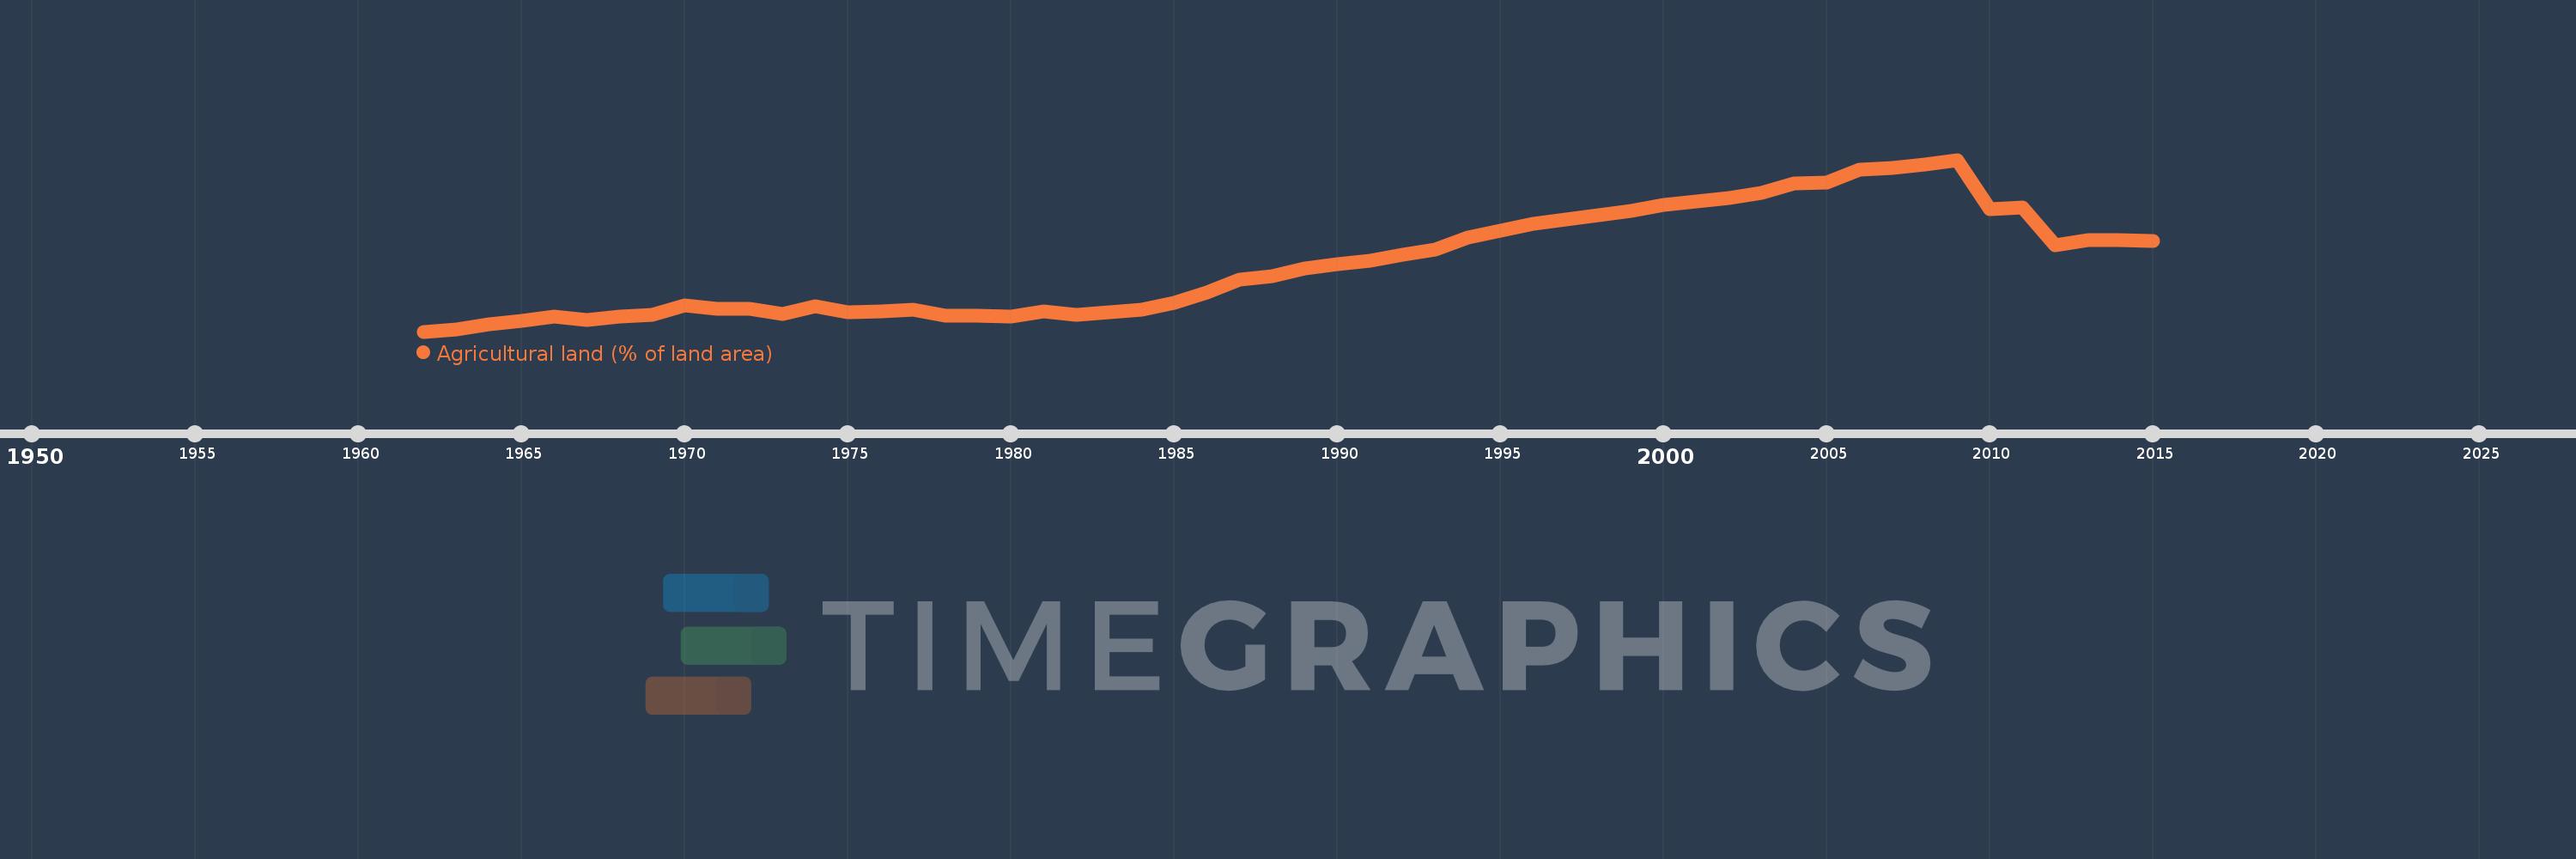
Agricultural land (% of land area)
2015,2014,2013,2012,2011,2010,2009,2008,2007,2006,2005,2004,2003,2002,2001,2000,1999,1998,1997,1996,1995,1994,1993,1992,1991,1990,1989,1988,1987,1986,1985,1984,1983,1982,1981,1980,1979,1978,1977,1976,1975,1974,1973,1972,1971,1970,1969,1968,1967,1966,1965,1964,1963,1962
This statistics in other country:
AfghanistanAlbaniaAlgeriaAmerican SamoaAndorraAngolaAntigua and BarbudaArab WorldArgentinaArmeniaArubaAustraliaAustriaAzerbaijanBahamas, TheBahrainBangladeshBarbadosBelarusBelgiumBelizeBeninBermudaBhutanBoliviaBosnia and HerzegovinaBotswanaBrazilBritish Virgin IslandsBrunei DarussalamBulgariaBurkina FasoBurundiCabo VerdeCambodiaCameroonCanadaCaribbean small statesCayman IslandsCentral African RepublicCentral Europe and the BalticsChadChannel IslandsChileChinaColombiaComorosCongo, Dem. Rep.Congo, Rep.Costa RicaCote d'IvoireCroatiaCubaCyprusCzech RepublicDenmarkDjiboutiDominicaDominican RepublicEarly-demographic dividendEast Asia & PacificEast Asia & Pacific (excluding high income)East Asia & Pacific (IDA & IBRD countries)EcuadorEgypt, Arab Rep.El SalvadorEquatorial GuineaEritreaEstoniaEthiopiaEuro areaEurope & Central AsiaEurope & Central Asia (excluding high income)Europe & Central Asia (IDA & IBRD countries)European UnionFaroe IslandsFijiFinlandFragile and conflict affected situationsFranceFrench PolynesiaGabonGambia, TheGeorgiaGermanyGhanaGreeceGreenlandGrenadaGuamGuatemalaGuineaGuinea-BissauGuyanaHaitiHeavily indebted poor countries (HIPC)High incomeHondurasHong Kong SAR, ChinaHungaryIBRD onlyIcelandIDA & IBRD totalIDA blendIDA onlyIDA totalIndiaIndonesiaIran, Islamic Rep.IraqIrelandIsle of ManIsraelItalyJamaicaJapanJordanKazakhstanKenyaKiribatiKorea, Dem. People’s Rep.Korea, Rep.KosovoKuwaitKyrgyz RepublicLao PDRLate-demographic dividendLatin America & Caribbean Latin America & Caribbean (excluding high income)Latin America & the Caribbean (IDA & IBRD countries)LatviaLeast developed countries: UN classificationLebanonLesothoLiberiaLibyaLiechtensteinLithuaniaLow & middle incomeLow incomeLower middle incomeLuxembourgMacedonia, FYRMadagascarMalawiMalaysiaMaldivesMaliMaltaMarshall IslandsMauritaniaMauritiusMexicoMicronesia, Fed. Sts.Middle East & North AfricaMiddle East & North Africa (excluding high income)Middle East & North Africa (IDA & IBRD countries)Middle incomeMoldovaMongoliaMontenegroMoroccoMozambiqueMyanmarNamibiaNauruNepalNetherlandsNew CaledoniaNew ZealandNicaraguaNigerNigeriaNorth AmericaNorthern Mariana IslandsNorwayOECD membersOmanOther small statesPacific island small statesPakistanPalauPanamaPapua New GuineaParaguayPeruPhilippinesPolandPortugalPost-demographic dividendPre-demographic dividendPuerto RicoQatarRomaniaRussian FederationRwandaSamoaSan MarinoSao Tome and PrincipeSaudi ArabiaSenegalSerbiaSeychellesSierra LeoneSingaporeSlovak RepublicSloveniaSmall statesSolomon IslandsSomaliaSouth AfricaSouth AsiaSouth Asia (IDA & IBRD)SpainSri LankaSt. Kitts and NevisSt. LuciaSt. Vincent and the GrenadinesSub-Saharan Africa Sub-Saharan Africa (excluding high income)Sub-Saharan Africa (IDA & IBRD countries)SudanSurinameSwazilandSwedenSwitzerlandSyrian Arab RepublicTajikistanTanzaniaThailandTimor-LesteTogoTongaTrinidad and TobagoTunisiaTurkeyTurkmenistanTurks and Caicos IslandsTuvaluUgandaUkraineUnited Arab EmiratesUnited KingdomUnited StatesUpper middle incomeUruguayUzbekistanVanuatuVenezuela, RBVietnamVirgin Islands (U.S.)West Bank and GazaWorldYemen, Rep.ZambiaZimbabwe Timeline:
This timeline shows a graph from 1962 to 2015 of Pre-demographic dividend. No data until 1961. Number of actual observations by date: 54.
Source name:
World Development Indicators
Source organization:
Food and Agriculture Organization, electronic files and web site.
Categories, topics:
Agriculture & Rural Development, Climate Change, Environment
Last updated:
apr 23, 2017
Indicators value changes by year
Maximum:
42.665
jan 1, 2009
At the date of observation
Value
Absolute change
Change from previous value
jan 1, 1962
36.55
+36.55
0.0%
jan 1, 1963
36.63
+0.08
0.22%
jan 1, 1964
36.822
+0.192
0.52%
jan 1, 1965
36.926
+0.104
0.28%
jan 1, 1966
37.071
+0.145
0.39%
jan 1, 1967
36.967
-0.104
-0.28%
jan 1, 1968
37.088
+0.12
0.33%
jan 1, 1969
37.159
+0.071
0.19%
jan 1, 1970
37.475
+0.316
0.85%
jan 1, 1971
37.356
-0.119
-0.32%
jan 1, 1972
37.362
+0.006
0.02%
jan 1, 1973
37.188
-0.174
-0.47%
jan 1, 1974
37.462
+0.274
0.74%
jan 1, 1975
37.252
-0.21
-0.56%
jan 1, 1976
37.271
+0.018
0.05%
jan 1, 1977
37.326
+0.056
0.15%
jan 1, 1978
37.118
-0.208
-0.56%
jan 1, 1979
37.119
+0.001
0.0%
jan 1, 1980
37.096
-0.023
-0.06%
jan 1, 1981
37.255
+0.159
0.43%
jan 1, 1982
37.152
-0.103
-0.28%
jan 1, 1983
37.249
+0.097
0.26%
jan 1, 1984
37.339
+0.09
0.24%
jan 1, 1985
37.57
+0.231
0.62%
jan 1, 1986
37.926
+0.356
0.95%
jan 1, 1987
38.403
+0.477
1.26%
jan 1, 1988
38.534
+0.131
0.34%
jan 1, 1989
38.792
+0.258
0.67%
jan 1, 1990
38.957
+0.165
0.42%
jan 1, 1991
39.068
+0.112
0.29%
jan 1, 1992
39.294
+0.225
0.58%
jan 1, 1993
39.46
+0.166
0.42%
jan 1, 1994
39.888
+0.429
1.09%
jan 1, 1995
40.144
+0.256
0.64%
jan 1, 1996
40.397
+0.253
0.63%
jan 1, 1997
40.541
+0.144
0.36%
jan 1, 1998
40.686
+0.146
0.36%
jan 1, 1999
40.832
+0.146
0.36%
jan 1, 2000
41.064
+0.232
0.57%
jan 1, 2001
41.17
+0.105
0.26%
jan 1, 2002
41.294
+0.124
0.3%
jan 1, 2003
41.482
+0.188
0.46%
jan 1, 2004
41.813
+0.33
0.8%
jan 1, 2005
41.856
+0.043
0.1%
jan 1, 2006
42.323
+0.467
1.12%
jan 1, 2007
42.378
+0.055
0.13%
jan 1, 2008
42.51
+0.133
0.31%
jan 1, 2009
42.665
+0.155
0.37%
jan 1, 2010
40.916
-1.749
-4.1%
jan 1, 2011
40.97
+0.054
0.13%
jan 1, 2012
39.616
-1.354
-3.31%
jan 1, 2013
39.816
+0.201
0.51%
jan 1, 2014
39.794
-0.022
-0.06%
jan 1, 2015
39.79
-0.004
-0.01%
Ranking of countries by current statistics by years


Comments: