29
/
en
AIzaSyAYiBZKx7MnpbEhh9jyipgxe19OcubqV5w
April 1, 2024
209969
Nicaragua
NIC
true
2
1
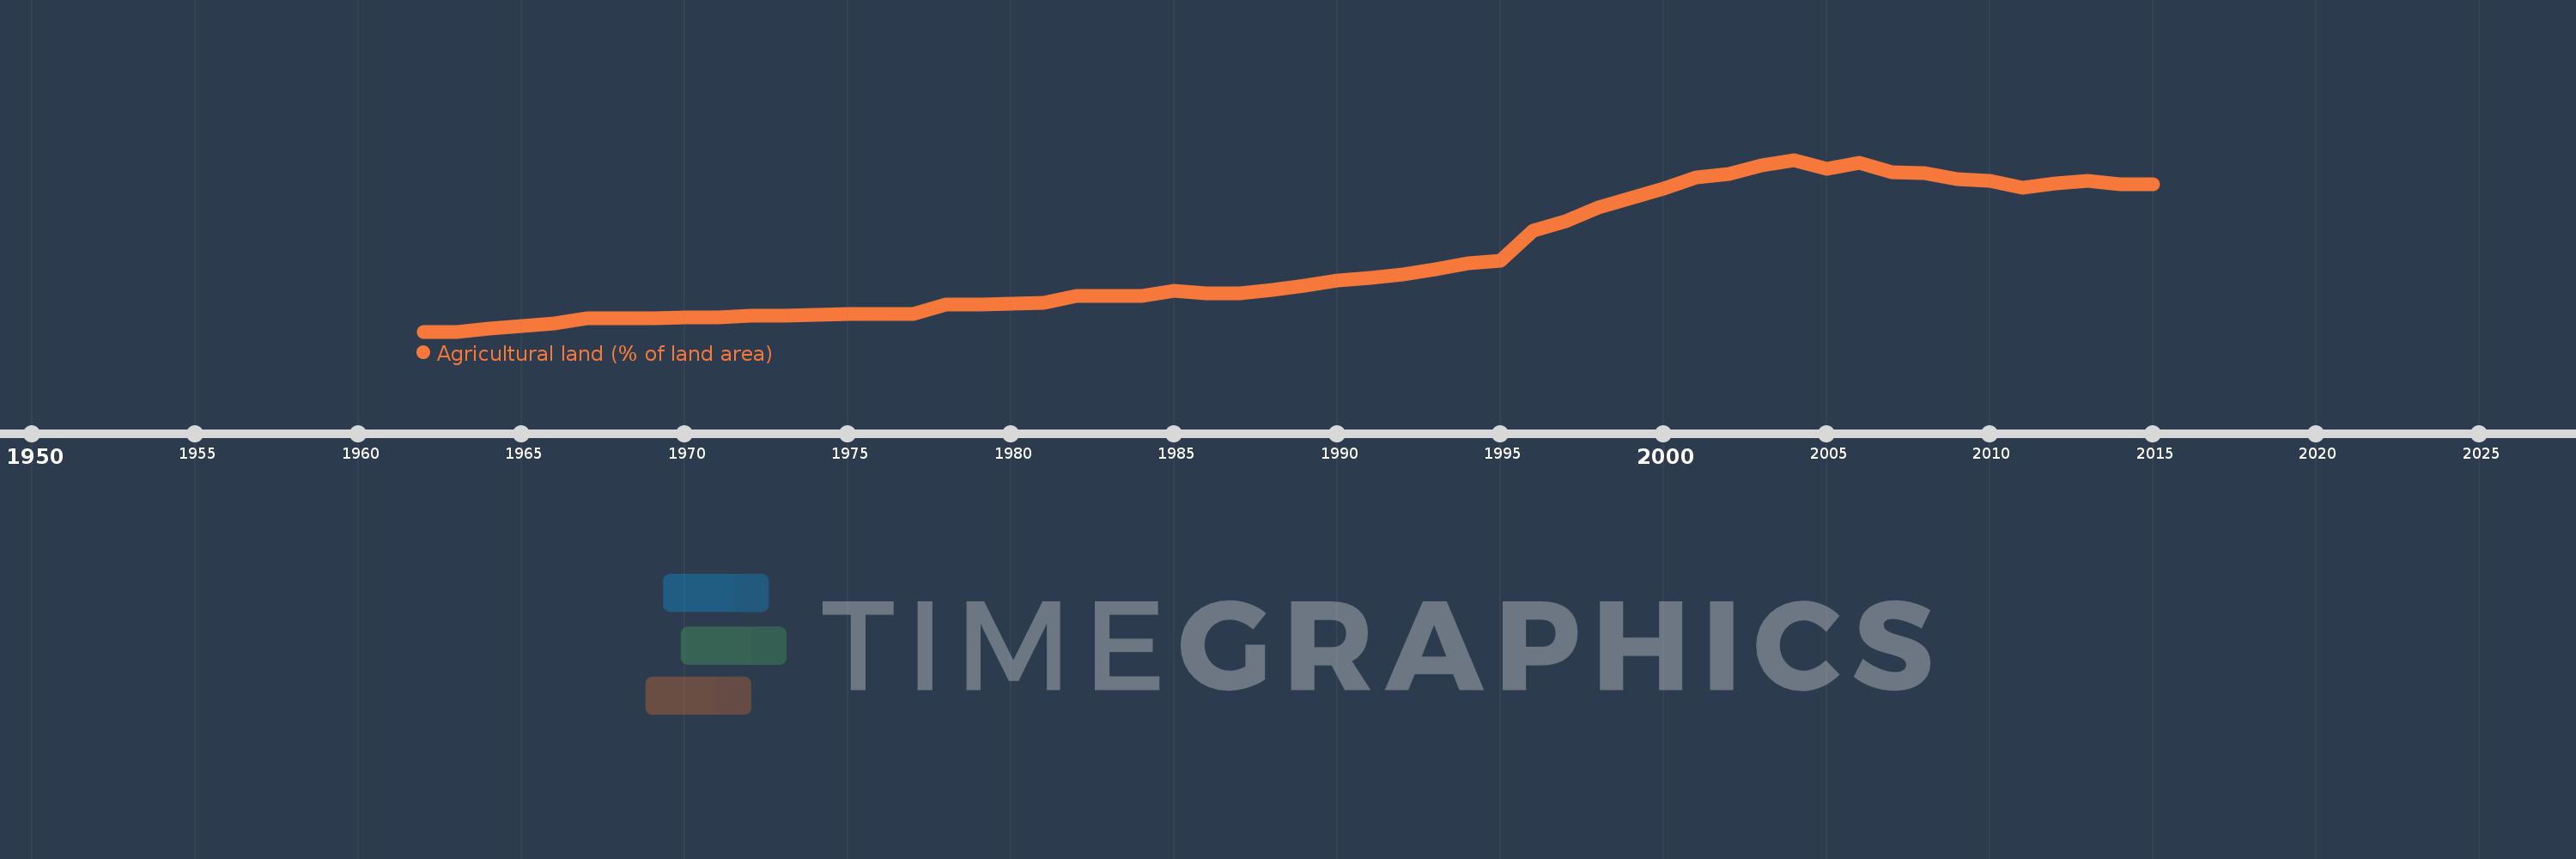
Agricultural land (% of land area)
2015,2014,2013,2012,2011,2010,2009,2008,2007,2006,2005,2004,2003,2002,2001,2000,1999,1998,1997,1996,1995,1994,1993,1992,1991,1990,1989,1988,1987,1986,1985,1984,1983,1982,1981,1980,1979,1978,1977,1976,1975,1974,1973,1972,1971,1970,1969,1968,1967,1966,1965,1964,1963,1962
This statistics in other country:
AfghanistanAlbaniaAlgeriaAmerican SamoaAndorraAngolaAntigua and BarbudaArab WorldArgentinaArmeniaArubaAustraliaAustriaAzerbaijanBahamas, TheBahrainBangladeshBarbadosBelarusBelgiumBelizeBeninBermudaBhutanBoliviaBosnia and HerzegovinaBotswanaBrazilBritish Virgin IslandsBrunei DarussalamBulgariaBurkina FasoBurundiCabo VerdeCambodiaCameroonCanadaCaribbean small statesCayman IslandsCentral African RepublicCentral Europe and the BalticsChadChannel IslandsChileChinaColombiaComorosCongo, Dem. Rep.Congo, Rep.Costa RicaCote d'IvoireCroatiaCubaCyprusCzech RepublicDenmarkDjiboutiDominicaDominican RepublicEarly-demographic dividendEast Asia & PacificEast Asia & Pacific (excluding high income)East Asia & Pacific (IDA & IBRD countries)EcuadorEgypt, Arab Rep.El SalvadorEquatorial GuineaEritreaEstoniaEthiopiaEuro areaEurope & Central AsiaEurope & Central Asia (excluding high income)Europe & Central Asia (IDA & IBRD countries)European UnionFaroe IslandsFijiFinlandFragile and conflict affected situationsFranceFrench PolynesiaGabonGambia, TheGeorgiaGermanyGhanaGreeceGreenlandGrenadaGuamGuatemalaGuineaGuinea-BissauGuyanaHaitiHeavily indebted poor countries (HIPC)High incomeHondurasHong Kong SAR, ChinaHungaryIBRD onlyIcelandIDA & IBRD totalIDA blendIDA onlyIDA totalIndiaIndonesiaIran, Islamic Rep.IraqIrelandIsle of ManIsraelItalyJamaicaJapanJordanKazakhstanKenyaKiribatiKorea, Dem. People’s Rep.Korea, Rep.KosovoKuwaitKyrgyz RepublicLao PDRLate-demographic dividendLatin America & Caribbean Latin America & Caribbean (excluding high income)Latin America & the Caribbean (IDA & IBRD countries)LatviaLeast developed countries: UN classificationLebanonLesothoLiberiaLibyaLiechtensteinLithuaniaLow & middle incomeLow incomeLower middle incomeLuxembourgMacedonia, FYRMadagascarMalawiMalaysiaMaldivesMaliMaltaMarshall IslandsMauritaniaMauritiusMexicoMicronesia, Fed. Sts.Middle East & North AfricaMiddle East & North Africa (excluding high income)Middle East & North Africa (IDA & IBRD countries)Middle incomeMoldovaMongoliaMontenegroMoroccoMozambiqueMyanmarNamibiaNauruNepalNetherlandsNew CaledoniaNew ZealandNicaraguaNigerNigeriaNorth AmericaNorthern Mariana IslandsNorwayOECD membersOmanOther small statesPacific island small statesPakistanPalauPanamaPapua New GuineaParaguayPeruPhilippinesPolandPortugalPost-demographic dividendPre-demographic dividendPuerto RicoQatarRomaniaRussian FederationRwandaSamoaSan MarinoSao Tome and PrincipeSaudi ArabiaSenegalSerbiaSeychellesSierra LeoneSingaporeSlovak RepublicSloveniaSmall statesSolomon IslandsSomaliaSouth AfricaSouth AsiaSouth Asia (IDA & IBRD)SpainSri LankaSt. Kitts and NevisSt. LuciaSt. Vincent and the GrenadinesSub-Saharan Africa Sub-Saharan Africa (excluding high income)Sub-Saharan Africa (IDA & IBRD countries)SudanSurinameSwazilandSwedenSwitzerlandSyrian Arab RepublicTajikistanTanzaniaThailandTimor-LesteTogoTongaTrinidad and TobagoTunisiaTurkeyTurkmenistanTurks and Caicos IslandsTuvaluUgandaUkraineUnited Arab EmiratesUnited KingdomUnited StatesUpper middle incomeUruguayUzbekistanVanuatuVenezuela, RBVietnamVirgin Islands (U.S.)West Bank and GazaWorldYemen, Rep.ZambiaZimbabwe Timeline:
This timeline shows a graph from 1962 to 2015 of Nicaragua. No data until 1961. Number of actual observations by date: 54.
Source name:
World Development Indicators
Source organization:
Food and Agriculture Organization, electronic files and web site.
Categories, topics:
Agriculture & Rural Development, Climate Change, Environment
Last updated:
apr 23, 2017
Indicators value changes by year
Minimum:
28.503
jan 1, 1962
Maximum:
44.341
jan 1, 2004
At the date of observation
Value
Absolute change
Change from previous value
jan 1, 1962
28.503
+28.503
0.0%
jan 1, 1963
28.503
0.0
0.0%
jan 1, 1964
28.818
+0.316
1.11%
jan 1, 1965
28.985
+0.166
0.58%
jan 1, 1966
29.234
+0.249
0.86%
jan 1, 1967
29.749
+0.515
1.76%
jan 1, 1968
29.749
0.0
0.0%
jan 1, 1969
29.749
0.0
0.0%
jan 1, 1970
29.791
+0.042
0.14%
jan 1, 1971
29.791
0.0
0.0%
jan 1, 1972
29.957
+0.166
0.56%
jan 1, 1973
29.998
+0.042
0.14%
jan 1, 1974
30.081
+0.083
0.28%
jan 1, 1975
30.165
+0.083
0.28%
jan 1, 1976
30.165
0.0
0.0%
jan 1, 1977
30.165
0.0
0.0%
jan 1, 1978
30.996
+0.831
2.75%
jan 1, 1979
31.037
+0.042
0.13%
jan 1, 1980
31.079
+0.042
0.13%
jan 1, 1981
31.12
+0.042
0.13%
jan 1, 1982
31.802
+0.681
2.19%
jan 1, 1983
31.818
+0.017
0.05%
jan 1, 1984
31.826
+0.008
0.03%
jan 1, 1985
32.267
+0.44
1.38%
jan 1, 1986
32.034
-0.233
-0.72%
jan 1, 1987
32.051
+0.017
0.05%
jan 1, 1988
32.317
+0.266
0.83%
jan 1, 1989
32.741
+0.424
1.31%
jan 1, 1990
33.181
+0.44
1.35%
jan 1, 1991
33.447
+0.266
0.8%
jan 1, 1992
33.738
+0.291
0.87%
jan 1, 1993
34.236
+0.499
1.48%
jan 1, 1994
34.818
+0.582
1.7%
jan 1, 1995
35.067
+0.249
0.72%
jan 1, 1996
37.834
+2.767
7.89%
jan 1, 1997
38.674
+0.839
2.22%
jan 1, 1998
39.953
+1.28
3.31%
jan 1, 1999
40.826
+0.873
2.18%
jan 1, 2000
41.699
+0.873
2.14%
jan 1, 2001
42.721
+1.022
2.45%
jan 1, 2002
43.003
+0.283
0.66%
jan 1, 2003
43.859
+0.856
1.99%
jan 1, 2004
44.341
+0.482
1.1%
jan 1, 2005
43.518
-0.823
-1.86%
jan 1, 2006
44.092
+0.573
1.32%
jan 1, 2007
43.211
-0.881
-2.0%
jan 1, 2008
43.086
-0.125
-0.29%
jan 1, 2009
42.546
-0.54
-1.25%
jan 1, 2010
42.421
-0.125
-0.29%
jan 1, 2011
41.765
-0.656
-1.55%
jan 1, 2012
42.138
+0.373
0.89%
jan 1, 2013
42.405
+0.267
0.63%
jan 1, 2014
42.089
-0.316
-0.74%
jan 1, 2015
42.089
0.0
0.0%
Ranking of countries by current statistics by years


Comments: