29
/
en
AIzaSyAYiBZKx7MnpbEhh9jyipgxe19OcubqV5w
April 1, 2024
248295
Sri Lanka
LKA
true
2
1
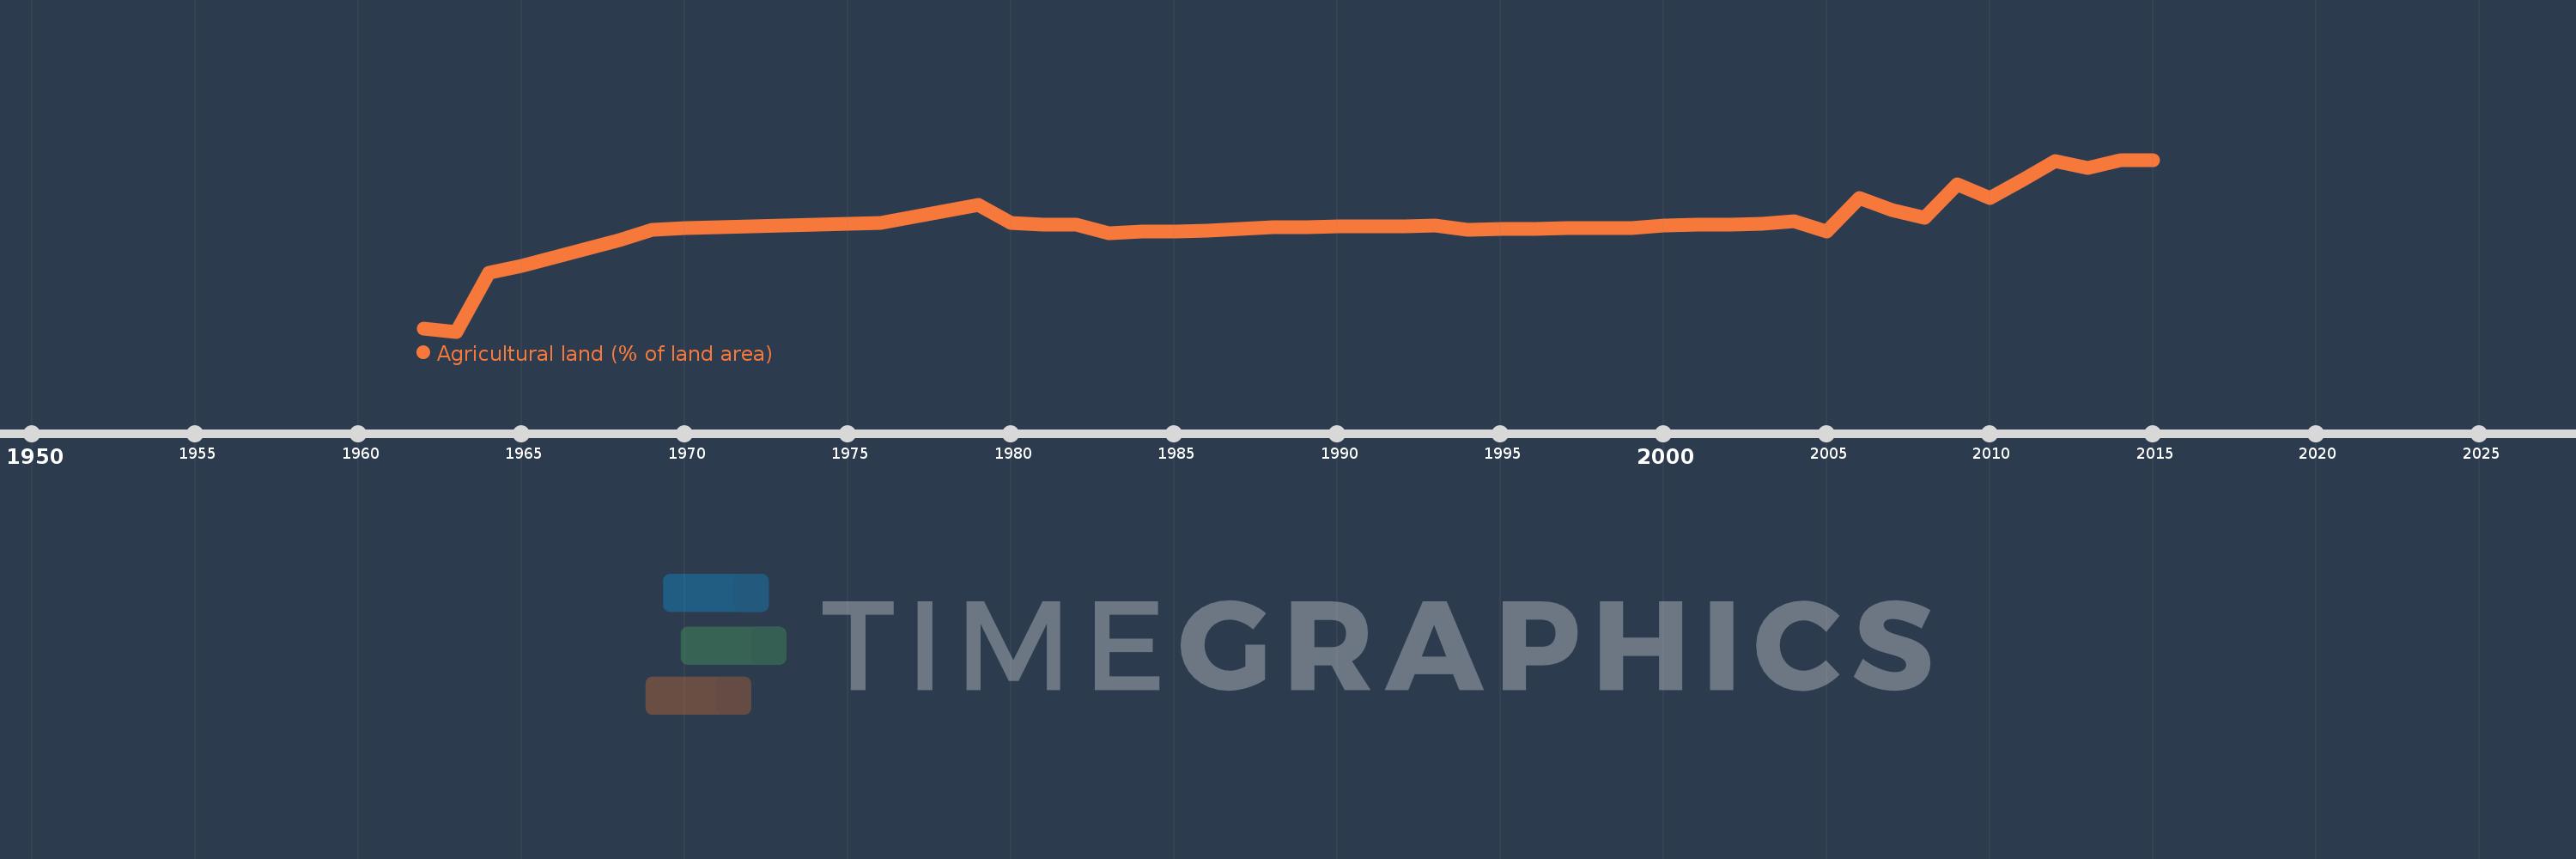
Agricultural land (% of land area)
2015,2014,2013,2012,2011,2010,2009,2008,2007,2006,2005,2004,2003,2002,2001,2000,1999,1998,1997,1996,1995,1994,1993,1992,1991,1990,1989,1988,1987,1986,1985,1984,1983,1982,1981,1980,1979,1978,1977,1976,1975,1974,1973,1972,1971,1970,1969,1968,1967,1966,1965,1964,1963,1962
This statistics in other country:
AfghanistanAlbaniaAlgeriaAmerican SamoaAndorraAngolaAntigua and BarbudaArab WorldArgentinaArmeniaArubaAustraliaAustriaAzerbaijanBahamas, TheBahrainBangladeshBarbadosBelarusBelgiumBelizeBeninBermudaBhutanBoliviaBosnia and HerzegovinaBotswanaBrazilBritish Virgin IslandsBrunei DarussalamBulgariaBurkina FasoBurundiCabo VerdeCambodiaCameroonCanadaCaribbean small statesCayman IslandsCentral African RepublicCentral Europe and the BalticsChadChannel IslandsChileChinaColombiaComorosCongo, Dem. Rep.Congo, Rep.Costa RicaCote d'IvoireCroatiaCubaCyprusCzech RepublicDenmarkDjiboutiDominicaDominican RepublicEarly-demographic dividendEast Asia & PacificEast Asia & Pacific (excluding high income)East Asia & Pacific (IDA & IBRD countries)EcuadorEgypt, Arab Rep.El SalvadorEquatorial GuineaEritreaEstoniaEthiopiaEuro areaEurope & Central AsiaEurope & Central Asia (excluding high income)Europe & Central Asia (IDA & IBRD countries)European UnionFaroe IslandsFijiFinlandFragile and conflict affected situationsFranceFrench PolynesiaGabonGambia, TheGeorgiaGermanyGhanaGreeceGreenlandGrenadaGuamGuatemalaGuineaGuinea-BissauGuyanaHaitiHeavily indebted poor countries (HIPC)High incomeHondurasHong Kong SAR, ChinaHungaryIBRD onlyIcelandIDA & IBRD totalIDA blendIDA onlyIDA totalIndiaIndonesiaIran, Islamic Rep.IraqIrelandIsle of ManIsraelItalyJamaicaJapanJordanKazakhstanKenyaKiribatiKorea, Dem. People’s Rep.Korea, Rep.KosovoKuwaitKyrgyz RepublicLao PDRLate-demographic dividendLatin America & Caribbean Latin America & Caribbean (excluding high income)Latin America & the Caribbean (IDA & IBRD countries)LatviaLeast developed countries: UN classificationLebanonLesothoLiberiaLibyaLiechtensteinLithuaniaLow & middle incomeLow incomeLower middle incomeLuxembourgMacedonia, FYRMadagascarMalawiMalaysiaMaldivesMaliMaltaMarshall IslandsMauritaniaMauritiusMexicoMicronesia, Fed. Sts.Middle East & North AfricaMiddle East & North Africa (excluding high income)Middle East & North Africa (IDA & IBRD countries)Middle incomeMoldovaMongoliaMontenegroMoroccoMozambiqueMyanmarNamibiaNauruNepalNetherlandsNew CaledoniaNew ZealandNicaraguaNigerNigeriaNorth AmericaNorthern Mariana IslandsNorwayOECD membersOmanOther small statesPacific island small statesPakistanPalauPanamaPapua New GuineaParaguayPeruPhilippinesPolandPortugalPost-demographic dividendPre-demographic dividendPuerto RicoQatarRomaniaRussian FederationRwandaSamoaSan MarinoSao Tome and PrincipeSaudi ArabiaSenegalSerbiaSeychellesSierra LeoneSingaporeSlovak RepublicSloveniaSmall statesSolomon IslandsSomaliaSouth AfricaSouth AsiaSouth Asia (IDA & IBRD)SpainSri LankaSt. Kitts and NevisSt. LuciaSt. Vincent and the GrenadinesSub-Saharan Africa Sub-Saharan Africa (excluding high income)Sub-Saharan Africa (IDA & IBRD countries)SudanSurinameSwazilandSwedenSwitzerlandSyrian Arab RepublicTajikistanTanzaniaThailandTimor-LesteTogoTongaTrinidad and TobagoTunisiaTurkeyTurkmenistanTurks and Caicos IslandsTuvaluUgandaUkraineUnited Arab EmiratesUnited KingdomUnited StatesUpper middle incomeUruguayUzbekistanVanuatuVenezuela, RBVietnamVirgin Islands (U.S.)West Bank and GazaWorldYemen, Rep.ZambiaZimbabwe Timeline:
This timeline shows a graph from 1962 to 2015 of Sri Lanka. No data until 1961. Number of actual observations by date: 54.
Source name:
World Development Indicators
Source organization:
Food and Agriculture Organization, electronic files and web site.
Categories, topics:
Agriculture & Rural Development, Climate Change, Environment
Last updated:
apr 23, 2017
Indicators value changes by year
Minimum:
27.221
jan 1, 1963
Maximum:
43.693
jan 1, 2014
At the date of observation
Value
Absolute change
Change from previous value
jan 1, 1962
27.476
+27.476
0.0%
jan 1, 1963
27.221
-0.255
-0.93%
jan 1, 1964
32.85
+5.629
20.68%
jan 1, 1965
33.535
+0.686
2.09%
jan 1, 1966
34.38
+0.845
2.52%
jan 1, 1967
35.162
+0.781
2.27%
jan 1, 1968
35.959
+0.797
2.27%
jan 1, 1969
37.012
+1.052
2.93%
jan 1, 1970
37.123
+0.112
0.3%
jan 1, 1971
37.203
+0.08
0.21%
jan 1, 1972
37.299
+0.096
0.26%
jan 1, 1973
37.394
+0.096
0.26%
jan 1, 1974
37.49
+0.096
0.26%
jan 1, 1975
37.586
+0.096
0.26%
jan 1, 1976
37.618
+0.032
0.08%
jan 1, 1977
38.208
+0.59
1.57%
jan 1, 1978
38.798
+0.59
1.54%
jan 1, 1979
39.372
+0.574
1.48%
jan 1, 1980
37.618
-1.754
-4.46%
jan 1, 1981
37.458
-0.159
-0.42%
jan 1, 1982
37.458
0.0
0.0%
jan 1, 1983
36.613
-0.845
-2.26%
jan 1, 1984
36.804
+0.191
0.52%
jan 1, 1985
36.852
+0.048
0.13%
jan 1, 1986
36.916
+0.064
0.17%
jan 1, 1987
37.091
+0.175
0.48%
jan 1, 1988
37.219
+0.128
0.34%
jan 1, 1989
37.267
+0.048
0.13%
jan 1, 1990
37.315
+0.048
0.13%
jan 1, 1991
37.299
-0.016
-0.04%
jan 1, 1992
37.347
+0.048
0.13%
jan 1, 1993
37.378
+0.032
0.09%
jan 1, 1994
36.996
-0.383
-1.02%
jan 1, 1995
37.044
+0.048
0.13%
jan 1, 1996
37.091
+0.048
0.13%
jan 1, 1997
37.107
+0.016
0.04%
jan 1, 1998
37.123
+0.016
0.04%
jan 1, 1999
37.139
+0.016
0.04%
jan 1, 2000
37.394
+0.255
0.69%
jan 1, 2001
37.474
+0.08
0.21%
jan 1, 2002
37.49
+0.016
0.04%
jan 1, 2003
37.57
+0.08
0.21%
jan 1, 2004
37.793
+0.223
0.59%
jan 1, 2005
36.836
-0.957
-2.53%
jan 1, 2006
40.026
+3.189
8.66%
jan 1, 2007
38.909
-1.116
-2.79%
jan 1, 2008
38.112
-0.797
-2.05%
jan 1, 2009
41.381
+3.269
8.58%
jan 1, 2010
40.026
-1.355
-3.28%
jan 1, 2011
41.78
+1.754
4.38%
jan 1, 2012
43.534
+1.754
4.2%
jan 1, 2013
42.896
-0.638
-1.47%
jan 1, 2014
43.693
+0.797
1.86%
jan 1, 2015
43.693
0.0
0.0%
Ranking of countries by current statistics by years


Comments: