29
/
en
AIzaSyAYiBZKx7MnpbEhh9jyipgxe19OcubqV5w
April 1, 2024
45835
Low income
LIC
false
2
1
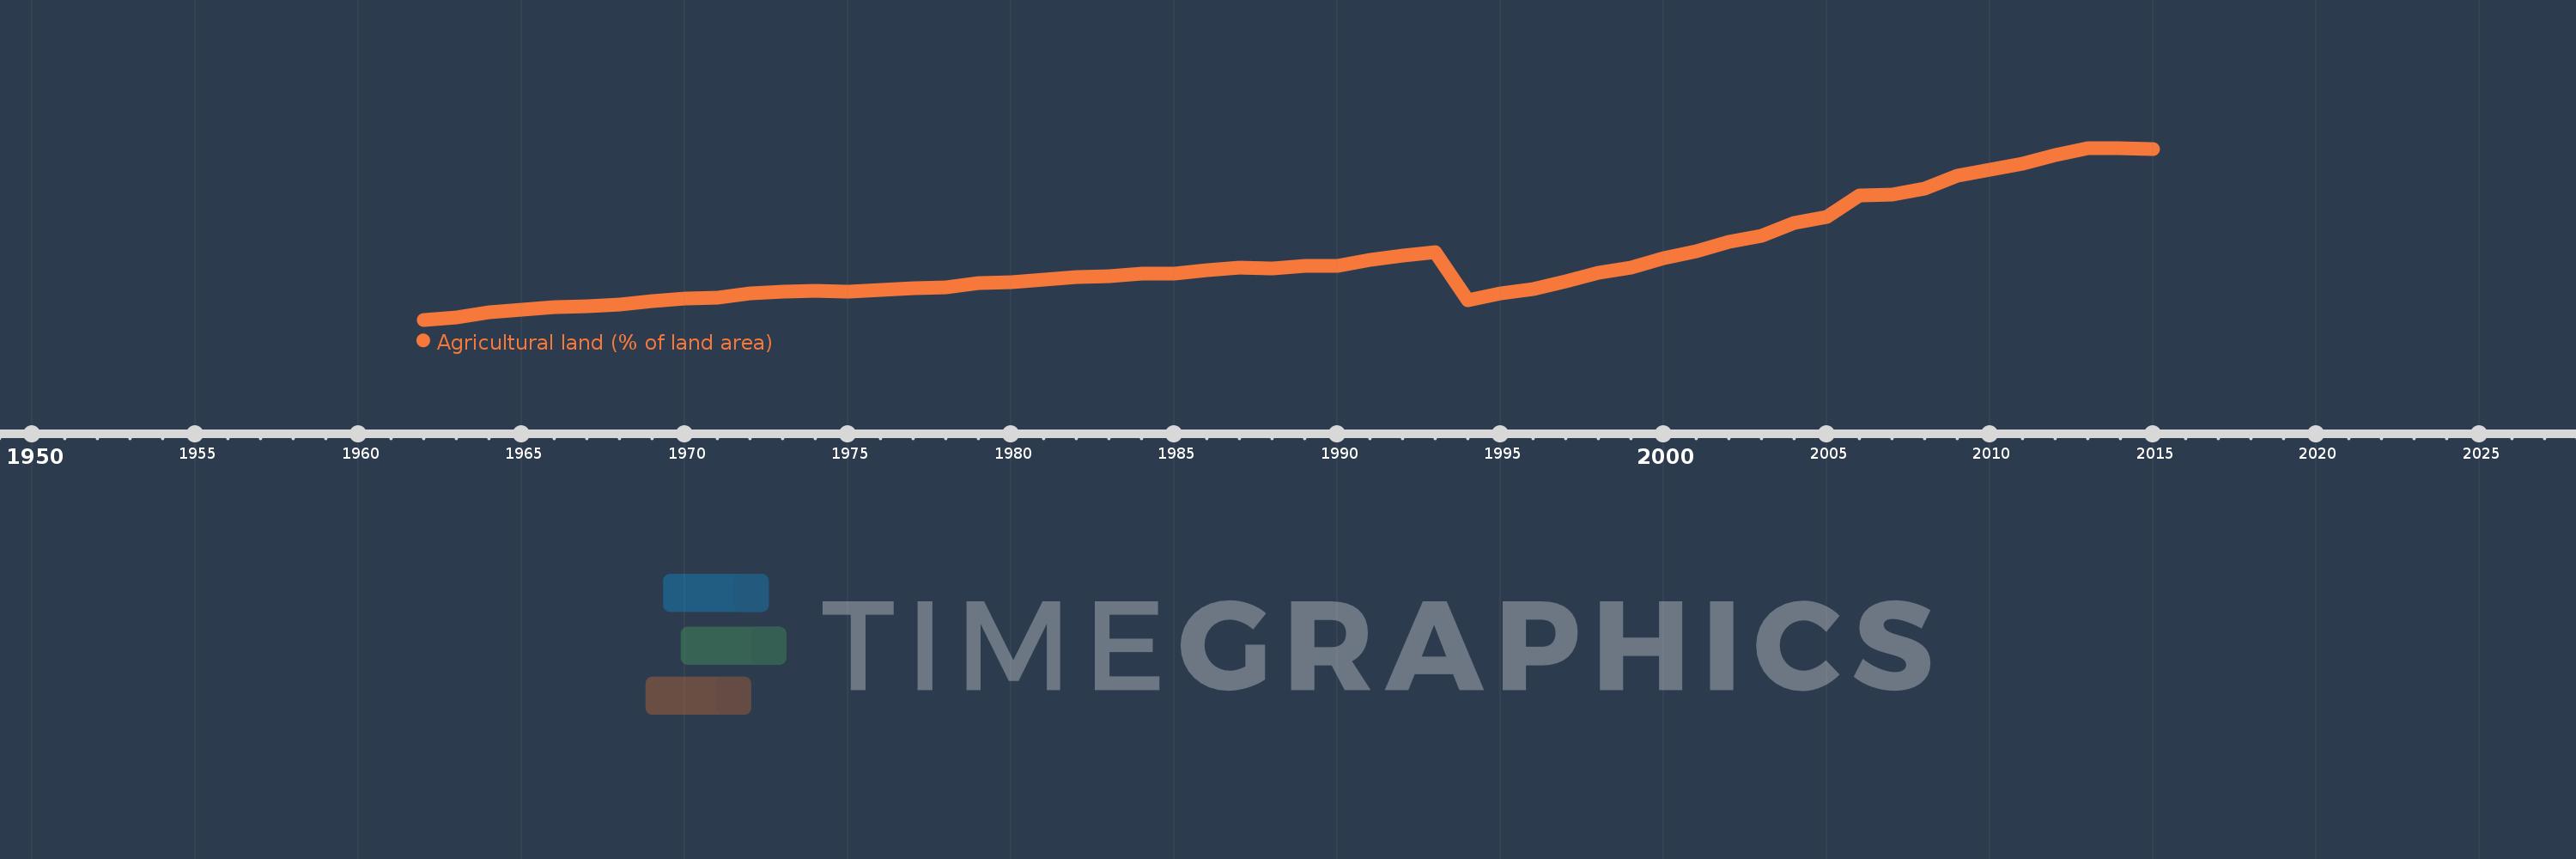
Agricultural land (% of land area)
2015,2014,2013,2012,2011,2010,2009,2008,2007,2006,2005,2004,2003,2002,2001,2000,1999,1998,1997,1996,1995,1994,1993,1992,1991,1990,1989,1988,1987,1986,1985,1984,1983,1982,1981,1980,1979,1978,1977,1976,1975,1974,1973,1972,1971,1970,1969,1968,1967,1966,1965,1964,1963,1962
This statistics in other country:
AfghanistanAlbaniaAlgeriaAmerican SamoaAndorraAngolaAntigua and BarbudaArab WorldArgentinaArmeniaArubaAustraliaAustriaAzerbaijanBahamas, TheBahrainBangladeshBarbadosBelarusBelgiumBelizeBeninBermudaBhutanBoliviaBosnia and HerzegovinaBotswanaBrazilBritish Virgin IslandsBrunei DarussalamBulgariaBurkina FasoBurundiCabo VerdeCambodiaCameroonCanadaCaribbean small statesCayman IslandsCentral African RepublicCentral Europe and the BalticsChadChannel IslandsChileChinaColombiaComorosCongo, Dem. Rep.Congo, Rep.Costa RicaCote d'IvoireCroatiaCubaCyprusCzech RepublicDenmarkDjiboutiDominicaDominican RepublicEarly-demographic dividendEast Asia & PacificEast Asia & Pacific (excluding high income)East Asia & Pacific (IDA & IBRD countries)EcuadorEgypt, Arab Rep.El SalvadorEquatorial GuineaEritreaEstoniaEthiopiaEuro areaEurope & Central AsiaEurope & Central Asia (excluding high income)Europe & Central Asia (IDA & IBRD countries)European UnionFaroe IslandsFijiFinlandFragile and conflict affected situationsFranceFrench PolynesiaGabonGambia, TheGeorgiaGermanyGhanaGreeceGreenlandGrenadaGuamGuatemalaGuineaGuinea-BissauGuyanaHaitiHeavily indebted poor countries (HIPC)High incomeHondurasHong Kong SAR, ChinaHungaryIBRD onlyIcelandIDA & IBRD totalIDA blendIDA onlyIDA totalIndiaIndonesiaIran, Islamic Rep.IraqIrelandIsle of ManIsraelItalyJamaicaJapanJordanKazakhstanKenyaKiribatiKorea, Dem. People’s Rep.Korea, Rep.KosovoKuwaitKyrgyz RepublicLao PDRLate-demographic dividendLatin America & Caribbean Latin America & Caribbean (excluding high income)Latin America & the Caribbean (IDA & IBRD countries)LatviaLeast developed countries: UN classificationLebanonLesothoLiberiaLibyaLiechtensteinLithuaniaLow & middle incomeLow incomeLower middle incomeLuxembourgMacedonia, FYRMadagascarMalawiMalaysiaMaldivesMaliMaltaMarshall IslandsMauritaniaMauritiusMexicoMicronesia, Fed. Sts.Middle East & North AfricaMiddle East & North Africa (excluding high income)Middle East & North Africa (IDA & IBRD countries)Middle incomeMoldovaMongoliaMontenegroMoroccoMozambiqueMyanmarNamibiaNauruNepalNetherlandsNew CaledoniaNew ZealandNicaraguaNigerNigeriaNorth AmericaNorthern Mariana IslandsNorwayOECD membersOmanOther small statesPacific island small statesPakistanPalauPanamaPapua New GuineaParaguayPeruPhilippinesPolandPortugalPost-demographic dividendPre-demographic dividendPuerto RicoQatarRomaniaRussian FederationRwandaSamoaSan MarinoSao Tome and PrincipeSaudi ArabiaSenegalSerbiaSeychellesSierra LeoneSingaporeSlovak RepublicSloveniaSmall statesSolomon IslandsSomaliaSouth AfricaSouth AsiaSouth Asia (IDA & IBRD)SpainSri LankaSt. Kitts and NevisSt. LuciaSt. Vincent and the GrenadinesSub-Saharan Africa Sub-Saharan Africa (excluding high income)Sub-Saharan Africa (IDA & IBRD countries)SudanSurinameSwazilandSwedenSwitzerlandSyrian Arab RepublicTajikistanTanzaniaThailandTimor-LesteTogoTongaTrinidad and TobagoTunisiaTurkeyTurkmenistanTurks and Caicos IslandsTuvaluUgandaUkraineUnited Arab EmiratesUnited KingdomUnited StatesUpper middle incomeUruguayUzbekistanVanuatuVenezuela, RBVietnamVirgin Islands (U.S.)West Bank and GazaWorldYemen, Rep.ZambiaZimbabwe Timeline:
This timeline shows a graph from 1962 to 2015 of Low income. No data until 1961. Number of actual observations by date: 54.
Source name:
World Development Indicators
Source organization:
Food and Agriculture Organization, electronic files and web site.
Categories, topics:
Agriculture & Rural Development, Climate Change, Environment
Last updated:
apr 23, 2017
Indicators value changes by year
Minimum:
34.741
jan 1, 1962
Maximum:
39.256
jan 1, 2013
At the date of observation
Value
Absolute change
Change from previous value
jan 1, 1962
34.741
+34.741
0.0%
jan 1, 1963
34.808
+0.067
0.19%
jan 1, 1964
34.935
+0.127
0.36%
jan 1, 1965
34.999
+0.065
0.19%
jan 1, 1966
35.062
+0.063
0.18%
jan 1, 1967
35.092
+0.03
0.09%
jan 1, 1968
35.13
+0.038
0.11%
jan 1, 1969
35.237
+0.107
0.3%
jan 1, 1970
35.29
+0.053
0.15%
jan 1, 1971
35.318
+0.028
0.08%
jan 1, 1972
35.437
+0.119
0.34%
jan 1, 1973
35.482
+0.045
0.13%
jan 1, 1974
35.505
+0.023
0.06%
jan 1, 1975
35.474
-0.031
-0.09%
jan 1, 1976
35.529
+0.055
0.15%
jan 1, 1977
35.575
+0.047
0.13%
jan 1, 1978
35.589
+0.013
0.04%
jan 1, 1979
35.701
+0.112
0.31%
jan 1, 1980
35.729
+0.029
0.08%
jan 1, 1981
35.793
+0.064
0.18%
jan 1, 1982
35.856
+0.063
0.18%
jan 1, 1983
35.882
+0.026
0.07%
jan 1, 1984
35.956
+0.073
0.2%
jan 1, 1985
35.952
-0.003
-0.01%
jan 1, 1986
36.049
+0.096
0.27%
jan 1, 1987
36.117
+0.068
0.19%
jan 1, 1988
36.093
-0.024
-0.07%
jan 1, 1989
36.149
+0.056
0.16%
jan 1, 1990
36.161
+0.012
0.03%
jan 1, 1991
36.305
+0.144
0.4%
jan 1, 1992
36.421
+0.116
0.32%
jan 1, 1993
36.508
+0.087
0.24%
jan 1, 1994
35.258
-1.25
-3.42%
jan 1, 1995
35.427
+0.169
0.48%
jan 1, 1996
35.555
+0.128
0.36%
jan 1, 1997
35.743
+0.188
0.53%
jan 1, 1998
35.971
+0.229
0.64%
jan 1, 1999
36.107
+0.136
0.38%
jan 1, 2000
36.352
+0.245
0.68%
jan 1, 2001
36.53
+0.178
0.49%
jan 1, 2002
36.797
+0.267
0.73%
jan 1, 2003
36.942
+0.146
0.4%
jan 1, 2004
37.274
+0.332
0.9%
jan 1, 2005
37.433
+0.159
0.43%
jan 1, 2006
38.001
+0.568
1.52%
jan 1, 2007
38.037
+0.035
0.09%
jan 1, 2008
38.194
+0.158
0.41%
jan 1, 2009
38.531
+0.337
0.88%
jan 1, 2010
38.683
+0.152
0.39%
jan 1, 2011
38.85
+0.168
0.43%
jan 1, 2012
39.062
+0.212
0.54%
jan 1, 2013
39.256
+0.194
0.5%
jan 1, 2014
39.248
-0.008
-0.02%
jan 1, 2015
39.231
-0.017
-0.04%
Ranking of countries by current statistics by years


Comments: