29
/
en
AIzaSyAYiBZKx7MnpbEhh9jyipgxe19OcubqV5w
April 1, 2024
42080
Latin America & Caribbean (excluding high income)
LAC
false
2
1
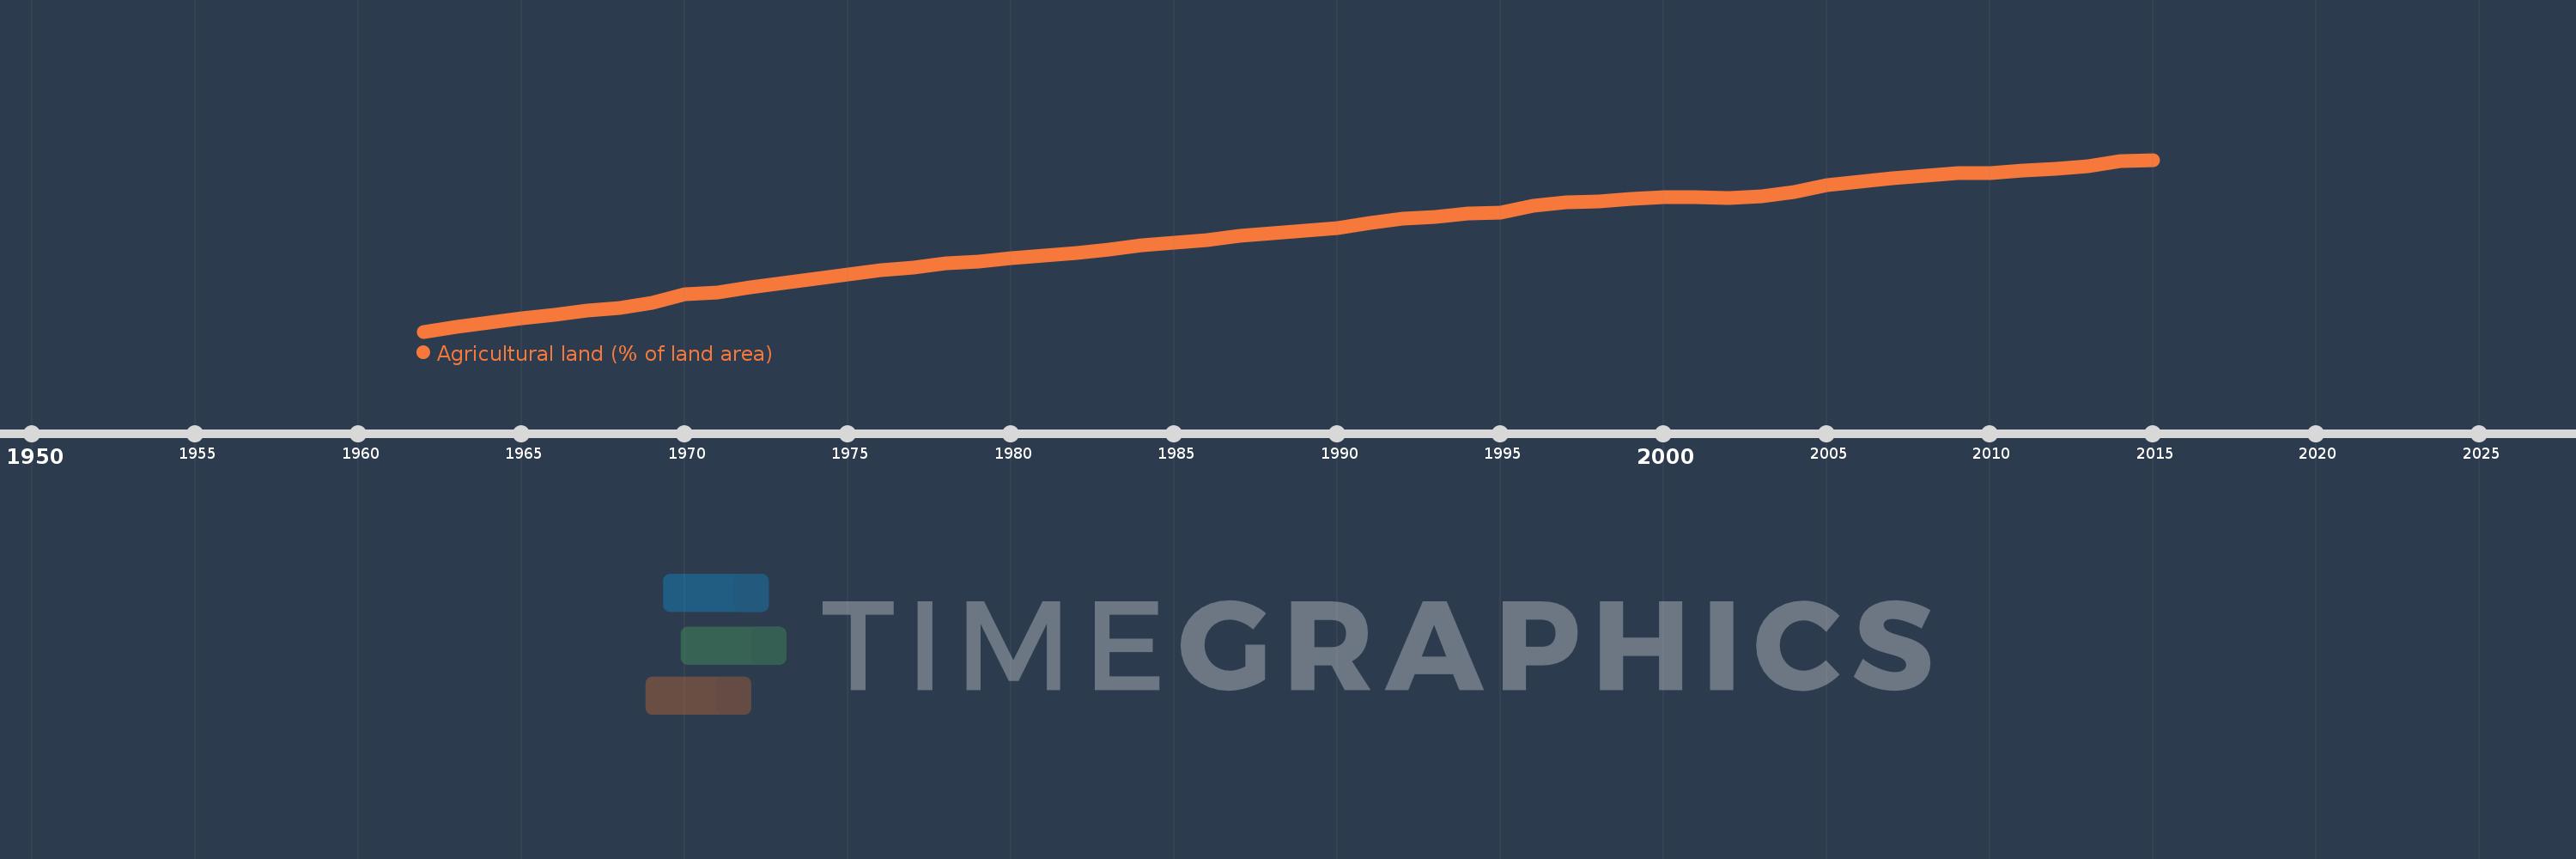
Agricultural land (% of land area)
2015,2014,2013,2012,2011,2010,2009,2008,2007,2006,2005,2004,2003,2002,2001,2000,1999,1998,1997,1996,1995,1994,1993,1992,1991,1990,1989,1988,1987,1986,1985,1984,1983,1982,1981,1980,1979,1978,1977,1976,1975,1974,1973,1972,1971,1970,1969,1968,1967,1966,1965,1964,1963,1962
This statistics in other country:
AfghanistanAlbaniaAlgeriaAmerican SamoaAndorraAngolaAntigua and BarbudaArab WorldArgentinaArmeniaArubaAustraliaAustriaAzerbaijanBahamas, TheBahrainBangladeshBarbadosBelarusBelgiumBelizeBeninBermudaBhutanBoliviaBosnia and HerzegovinaBotswanaBrazilBritish Virgin IslandsBrunei DarussalamBulgariaBurkina FasoBurundiCabo VerdeCambodiaCameroonCanadaCaribbean small statesCayman IslandsCentral African RepublicCentral Europe and the BalticsChadChannel IslandsChileChinaColombiaComorosCongo, Dem. Rep.Congo, Rep.Costa RicaCote d'IvoireCroatiaCubaCyprusCzech RepublicDenmarkDjiboutiDominicaDominican RepublicEarly-demographic dividendEast Asia & PacificEast Asia & Pacific (excluding high income)East Asia & Pacific (IDA & IBRD countries)EcuadorEgypt, Arab Rep.El SalvadorEquatorial GuineaEritreaEstoniaEthiopiaEuro areaEurope & Central AsiaEurope & Central Asia (excluding high income)Europe & Central Asia (IDA & IBRD countries)European UnionFaroe IslandsFijiFinlandFragile and conflict affected situationsFranceFrench PolynesiaGabonGambia, TheGeorgiaGermanyGhanaGreeceGreenlandGrenadaGuamGuatemalaGuineaGuinea-BissauGuyanaHaitiHeavily indebted poor countries (HIPC)High incomeHondurasHong Kong SAR, ChinaHungaryIBRD onlyIcelandIDA & IBRD totalIDA blendIDA onlyIDA totalIndiaIndonesiaIran, Islamic Rep.IraqIrelandIsle of ManIsraelItalyJamaicaJapanJordanKazakhstanKenyaKiribatiKorea, Dem. People’s Rep.Korea, Rep.KosovoKuwaitKyrgyz RepublicLao PDRLate-demographic dividendLatin America & Caribbean Latin America & Caribbean (excluding high income)Latin America & the Caribbean (IDA & IBRD countries)LatviaLeast developed countries: UN classificationLebanonLesothoLiberiaLibyaLiechtensteinLithuaniaLow & middle incomeLow incomeLower middle incomeLuxembourgMacedonia, FYRMadagascarMalawiMalaysiaMaldivesMaliMaltaMarshall IslandsMauritaniaMauritiusMexicoMicronesia, Fed. Sts.Middle East & North AfricaMiddle East & North Africa (excluding high income)Middle East & North Africa (IDA & IBRD countries)Middle incomeMoldovaMongoliaMontenegroMoroccoMozambiqueMyanmarNamibiaNauruNepalNetherlandsNew CaledoniaNew ZealandNicaraguaNigerNigeriaNorth AmericaNorthern Mariana IslandsNorwayOECD membersOmanOther small statesPacific island small statesPakistanPalauPanamaPapua New GuineaParaguayPeruPhilippinesPolandPortugalPost-demographic dividendPre-demographic dividendPuerto RicoQatarRomaniaRussian FederationRwandaSamoaSan MarinoSao Tome and PrincipeSaudi ArabiaSenegalSerbiaSeychellesSierra LeoneSingaporeSlovak RepublicSloveniaSmall statesSolomon IslandsSomaliaSouth AfricaSouth AsiaSouth Asia (IDA & IBRD)SpainSri LankaSt. Kitts and NevisSt. LuciaSt. Vincent and the GrenadinesSub-Saharan Africa Sub-Saharan Africa (excluding high income)Sub-Saharan Africa (IDA & IBRD countries)SudanSurinameSwazilandSwedenSwitzerlandSyrian Arab RepublicTajikistanTanzaniaThailandTimor-LesteTogoTongaTrinidad and TobagoTunisiaTurkeyTurkmenistanTurks and Caicos IslandsTuvaluUgandaUkraineUnited Arab EmiratesUnited KingdomUnited StatesUpper middle incomeUruguayUzbekistanVanuatuVenezuela, RBVietnamVirgin Islands (U.S.)West Bank and GazaWorldYemen, Rep.ZambiaZimbabwe Timeline:
This timeline shows a graph from 1962 to 2015 of Latin America & Caribbean (excluding high income). No data until 1961. Number of actual observations by date: 54.
Source name:
World Development Indicators
Source organization:
Food and Agriculture Organization, electronic files and web site.
Categories, topics:
Agriculture & Rural Development, Climate Change, Environment
Last updated:
apr 23, 2017
Indicators value changes by year
Minimum:
27.754
jan 1, 1962
Maximum:
37.955
jan 1, 2015
At the date of observation
Value
Absolute change
Change from previous value
jan 1, 1962
27.754
+27.754
0.0%
jan 1, 1963
28.037
+0.282
1.02%
jan 1, 1964
28.31
+0.273
0.97%
jan 1, 1965
28.558
+0.249
0.88%
jan 1, 1966
28.768
+0.21
0.74%
jan 1, 1967
28.984
+0.216
0.75%
jan 1, 1968
29.171
+0.187
0.64%
jan 1, 1969
29.466
+0.295
1.01%
jan 1, 1970
29.949
+0.483
1.64%
jan 1, 1971
30.068
+0.119
0.4%
jan 1, 1972
30.4
+0.332
1.1%
jan 1, 1973
30.656
+0.257
0.84%
jan 1, 1974
30.872
+0.216
0.7%
jan 1, 1975
31.139
+0.267
0.86%
jan 1, 1976
31.383
+0.244
0.78%
jan 1, 1977
31.575
+0.192
0.61%
jan 1, 1978
31.812
+0.237
0.75%
jan 1, 1979
31.923
+0.111
0.35%
jan 1, 1980
32.104
+0.181
0.57%
jan 1, 1981
32.26
+0.156
0.49%
jan 1, 1982
32.414
+0.154
0.48%
jan 1, 1983
32.645
+0.231
0.71%
jan 1, 1984
32.87
+0.225
0.69%
jan 1, 1985
33.037
+0.167
0.51%
jan 1, 1986
33.162
+0.125
0.38%
jan 1, 1987
33.429
+0.267
0.81%
jan 1, 1988
33.617
+0.188
0.56%
jan 1, 1989
33.744
+0.127
0.38%
jan 1, 1990
33.896
+0.152
0.45%
jan 1, 1991
34.217
+0.321
0.95%
jan 1, 1992
34.466
+0.249
0.73%
jan 1, 1993
34.574
+0.108
0.31%
jan 1, 1994
34.761
+0.187
0.54%
jan 1, 1995
34.796
+0.034
0.1%
jan 1, 1996
35.213
+0.417
1.2%
jan 1, 1997
35.414
+0.201
0.57%
jan 1, 1998
35.495
+0.08
0.23%
jan 1, 1999
35.65
+0.156
0.44%
jan 1, 2000
35.739
+0.089
0.25%
jan 1, 2001
35.752
+0.013
0.04%
jan 1, 2002
35.703
-0.05
-0.14%
jan 1, 2003
35.776
+0.073
0.21%
jan 1, 2004
36.029
+0.253
0.71%
jan 1, 2005
36.429
+0.4
1.11%
jan 1, 2006
36.676
+0.247
0.68%
jan 1, 2007
36.851
+0.175
0.48%
jan 1, 2008
37.015
+0.164
0.44%
jan 1, 2009
37.145
+0.13
0.35%
jan 1, 2010
37.149
+0.004
0.01%
jan 1, 2011
37.338
+0.189
0.51%
jan 1, 2012
37.439
+0.101
0.27%
jan 1, 2013
37.571
+0.132
0.35%
jan 1, 2014
37.864
+0.293
0.78%
jan 1, 2015
37.955
+0.092
0.24%
Ranking of countries by current statistics by years


Comments: