29
/
en
AIzaSyAYiBZKx7MnpbEhh9jyipgxe19OcubqV5w
April 1, 2024
34025
Fragile and conflict affected situations
FCS
false
2
1
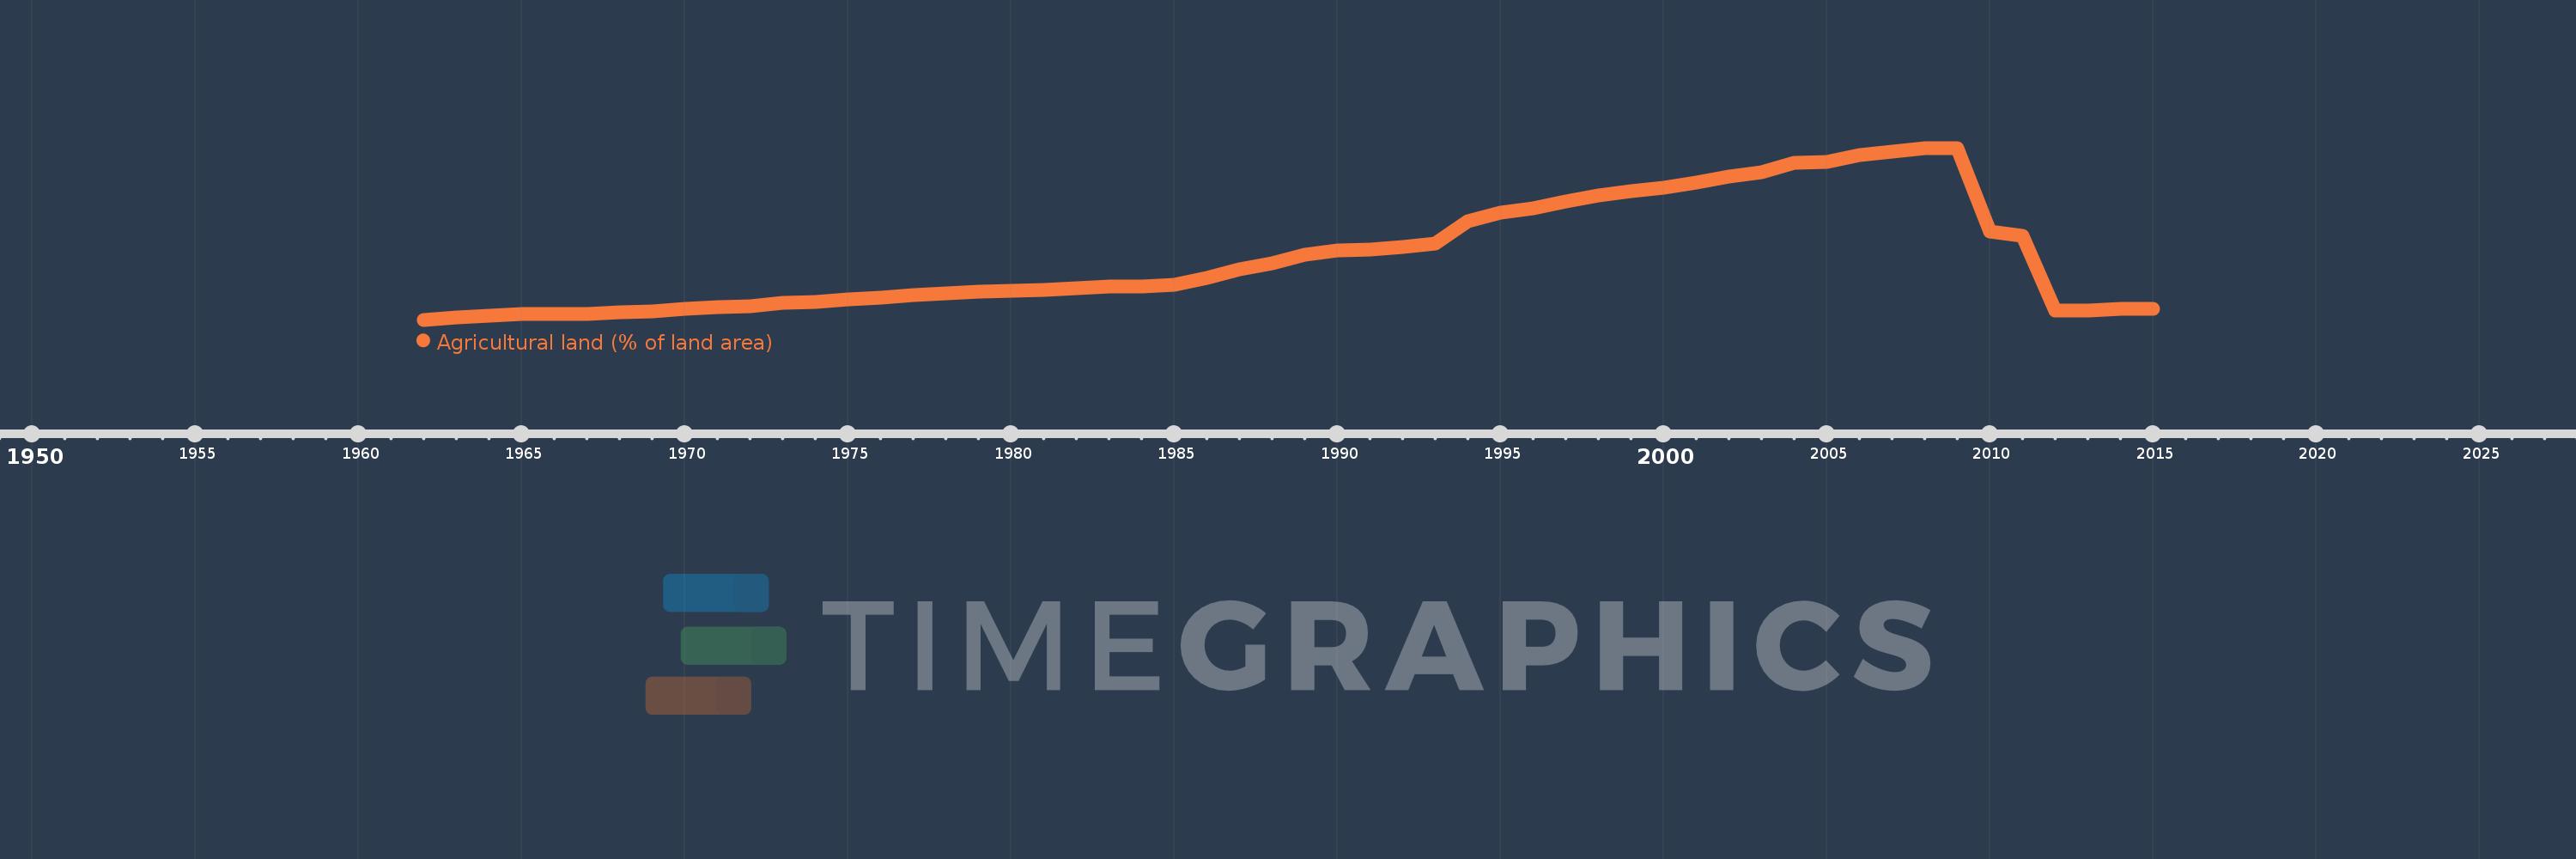
Agricultural land (% of land area)
2015,2014,2013,2012,2011,2010,2009,2008,2007,2006,2005,2004,2003,2002,2001,2000,1999,1998,1997,1996,1995,1994,1993,1992,1991,1990,1989,1988,1987,1986,1985,1984,1983,1982,1981,1980,1979,1978,1977,1976,1975,1974,1973,1972,1971,1970,1969,1968,1967,1966,1965,1964,1963,1962
This statistics in other country:
AfghanistanAlbaniaAlgeriaAmerican SamoaAndorraAngolaAntigua and BarbudaArab WorldArgentinaArmeniaArubaAustraliaAustriaAzerbaijanBahamas, TheBahrainBangladeshBarbadosBelarusBelgiumBelizeBeninBermudaBhutanBoliviaBosnia and HerzegovinaBotswanaBrazilBritish Virgin IslandsBrunei DarussalamBulgariaBurkina FasoBurundiCabo VerdeCambodiaCameroonCanadaCaribbean small statesCayman IslandsCentral African RepublicCentral Europe and the BalticsChadChannel IslandsChileChinaColombiaComorosCongo, Dem. Rep.Congo, Rep.Costa RicaCote d'IvoireCroatiaCubaCyprusCzech RepublicDenmarkDjiboutiDominicaDominican RepublicEarly-demographic dividendEast Asia & PacificEast Asia & Pacific (excluding high income)East Asia & Pacific (IDA & IBRD countries)EcuadorEgypt, Arab Rep.El SalvadorEquatorial GuineaEritreaEstoniaEthiopiaEuro areaEurope & Central AsiaEurope & Central Asia (excluding high income)Europe & Central Asia (IDA & IBRD countries)European UnionFaroe IslandsFijiFinlandFragile and conflict affected situationsFranceFrench PolynesiaGabonGambia, TheGeorgiaGermanyGhanaGreeceGreenlandGrenadaGuamGuatemalaGuineaGuinea-BissauGuyanaHaitiHeavily indebted poor countries (HIPC)High incomeHondurasHong Kong SAR, ChinaHungaryIBRD onlyIcelandIDA & IBRD totalIDA blendIDA onlyIDA totalIndiaIndonesiaIran, Islamic Rep.IraqIrelandIsle of ManIsraelItalyJamaicaJapanJordanKazakhstanKenyaKiribatiKorea, Dem. People’s Rep.Korea, Rep.KosovoKuwaitKyrgyz RepublicLao PDRLate-demographic dividendLatin America & Caribbean Latin America & Caribbean (excluding high income)Latin America & the Caribbean (IDA & IBRD countries)LatviaLeast developed countries: UN classificationLebanonLesothoLiberiaLibyaLiechtensteinLithuaniaLow & middle incomeLow incomeLower middle incomeLuxembourgMacedonia, FYRMadagascarMalawiMalaysiaMaldivesMaliMaltaMarshall IslandsMauritaniaMauritiusMexicoMicronesia, Fed. Sts.Middle East & North AfricaMiddle East & North Africa (excluding high income)Middle East & North Africa (IDA & IBRD countries)Middle incomeMoldovaMongoliaMontenegroMoroccoMozambiqueMyanmarNamibiaNauruNepalNetherlandsNew CaledoniaNew ZealandNicaraguaNigerNigeriaNorth AmericaNorthern Mariana IslandsNorwayOECD membersOmanOther small statesPacific island small statesPakistanPalauPanamaPapua New GuineaParaguayPeruPhilippinesPolandPortugalPost-demographic dividendPre-demographic dividendPuerto RicoQatarRomaniaRussian FederationRwandaSamoaSan MarinoSao Tome and PrincipeSaudi ArabiaSenegalSerbiaSeychellesSierra LeoneSingaporeSlovak RepublicSloveniaSmall statesSolomon IslandsSomaliaSouth AfricaSouth AsiaSouth Asia (IDA & IBRD)SpainSri LankaSt. Kitts and NevisSt. LuciaSt. Vincent and the GrenadinesSub-Saharan Africa Sub-Saharan Africa (excluding high income)Sub-Saharan Africa (IDA & IBRD countries)SudanSurinameSwazilandSwedenSwitzerlandSyrian Arab RepublicTajikistanTanzaniaThailandTimor-LesteTogoTongaTrinidad and TobagoTunisiaTurkeyTurkmenistanTurks and Caicos IslandsTuvaluUgandaUkraineUnited Arab EmiratesUnited KingdomUnited StatesUpper middle incomeUruguayUzbekistanVanuatuVenezuela, RBVietnamVirgin Islands (U.S.)West Bank and GazaWorldYemen, Rep.ZambiaZimbabwe Timeline:
This timeline shows a graph from 1962 to 2015 of Fragile and conflict affected situations. No data until 1961. Number of actual observations by date: 54.
Source name:
World Development Indicators
Source organization:
Food and Agriculture Organization, electronic files and web site.
Categories, topics:
Agriculture & Rural Development, Climate Change, Environment
Last updated:
apr 23, 2017
Indicators value changes by year
Minimum:
30.357
jan 1, 1962
Maximum:
34.991
jan 1, 2009
At the date of observation
Value
Absolute change
Change from previous value
jan 1, 1962
30.357
+30.357
0.0%
jan 1, 1963
30.417
+0.06
0.2%
jan 1, 1964
30.466
+0.049
0.16%
jan 1, 1965
30.503
+0.038
0.12%
jan 1, 1966
30.507
+0.004
0.01%
jan 1, 1967
30.509
+0.002
0.01%
jan 1, 1968
30.565
+0.055
0.18%
jan 1, 1969
30.588
+0.024
0.08%
jan 1, 1970
30.647
+0.058
0.19%
jan 1, 1971
30.688
+0.042
0.14%
jan 1, 1972
30.722
+0.034
0.11%
jan 1, 1973
30.808
+0.086
0.28%
jan 1, 1974
30.845
+0.038
0.12%
jan 1, 1975
30.909
+0.064
0.21%
jan 1, 1976
30.946
+0.037
0.12%
jan 1, 1977
31.014
+0.068
0.22%
jan 1, 1978
31.06
+0.046
0.15%
jan 1, 1979
31.114
+0.054
0.17%
jan 1, 1980
31.138
+0.024
0.08%
jan 1, 1981
31.172
+0.034
0.11%
jan 1, 1982
31.209
+0.037
0.12%
jan 1, 1983
31.243
+0.034
0.11%
jan 1, 1984
31.262
+0.02
0.06%
jan 1, 1985
31.303
+0.041
0.13%
jan 1, 1986
31.482
+0.179
0.57%
jan 1, 1987
31.714
+0.232
0.74%
jan 1, 1988
31.872
+0.158
0.5%
jan 1, 1989
32.104
+0.232
0.73%
jan 1, 1990
32.223
+0.119
0.37%
jan 1, 1991
32.254
+0.032
0.1%
jan 1, 1992
32.31
+0.056
0.17%
jan 1, 1993
32.411
+0.101
0.31%
jan 1, 1994
33.024
+0.612
1.89%
jan 1, 1995
33.253
+0.229
0.69%
jan 1, 1996
33.361
+0.108
0.32%
jan 1, 1997
33.556
+0.195
0.58%
jan 1, 1998
33.711
+0.155
0.46%
jan 1, 1999
33.818
+0.107
0.32%
jan 1, 2000
33.913
+0.095
0.28%
jan 1, 2001
34.067
+0.154
0.45%
jan 1, 2002
34.222
+0.156
0.46%
jan 1, 2003
34.342
+0.12
0.35%
jan 1, 2004
34.588
+0.246
0.72%
jan 1, 2005
34.607
+0.019
0.05%
jan 1, 2006
34.81
+0.203
0.59%
jan 1, 2007
34.899
+0.089
0.26%
jan 1, 2008
34.988
+0.089
0.25%
jan 1, 2009
34.991
+0.003
0.01%
jan 1, 2010
32.727
-2.264
-6.47%
jan 1, 2011
32.624
-0.104
-0.32%
jan 1, 2012
30.595
-2.029
-6.22%
jan 1, 2013
30.602
+0.008
0.02%
jan 1, 2014
30.642
+0.039
0.13%
jan 1, 2015
30.649
+0.007
0.02%
Ranking of countries by current statistics by years


Comments: