29
/
en
AIzaSyAYiBZKx7MnpbEhh9jyipgxe19OcubqV5w
April 1, 2024
154208
India
IND
true
2
1
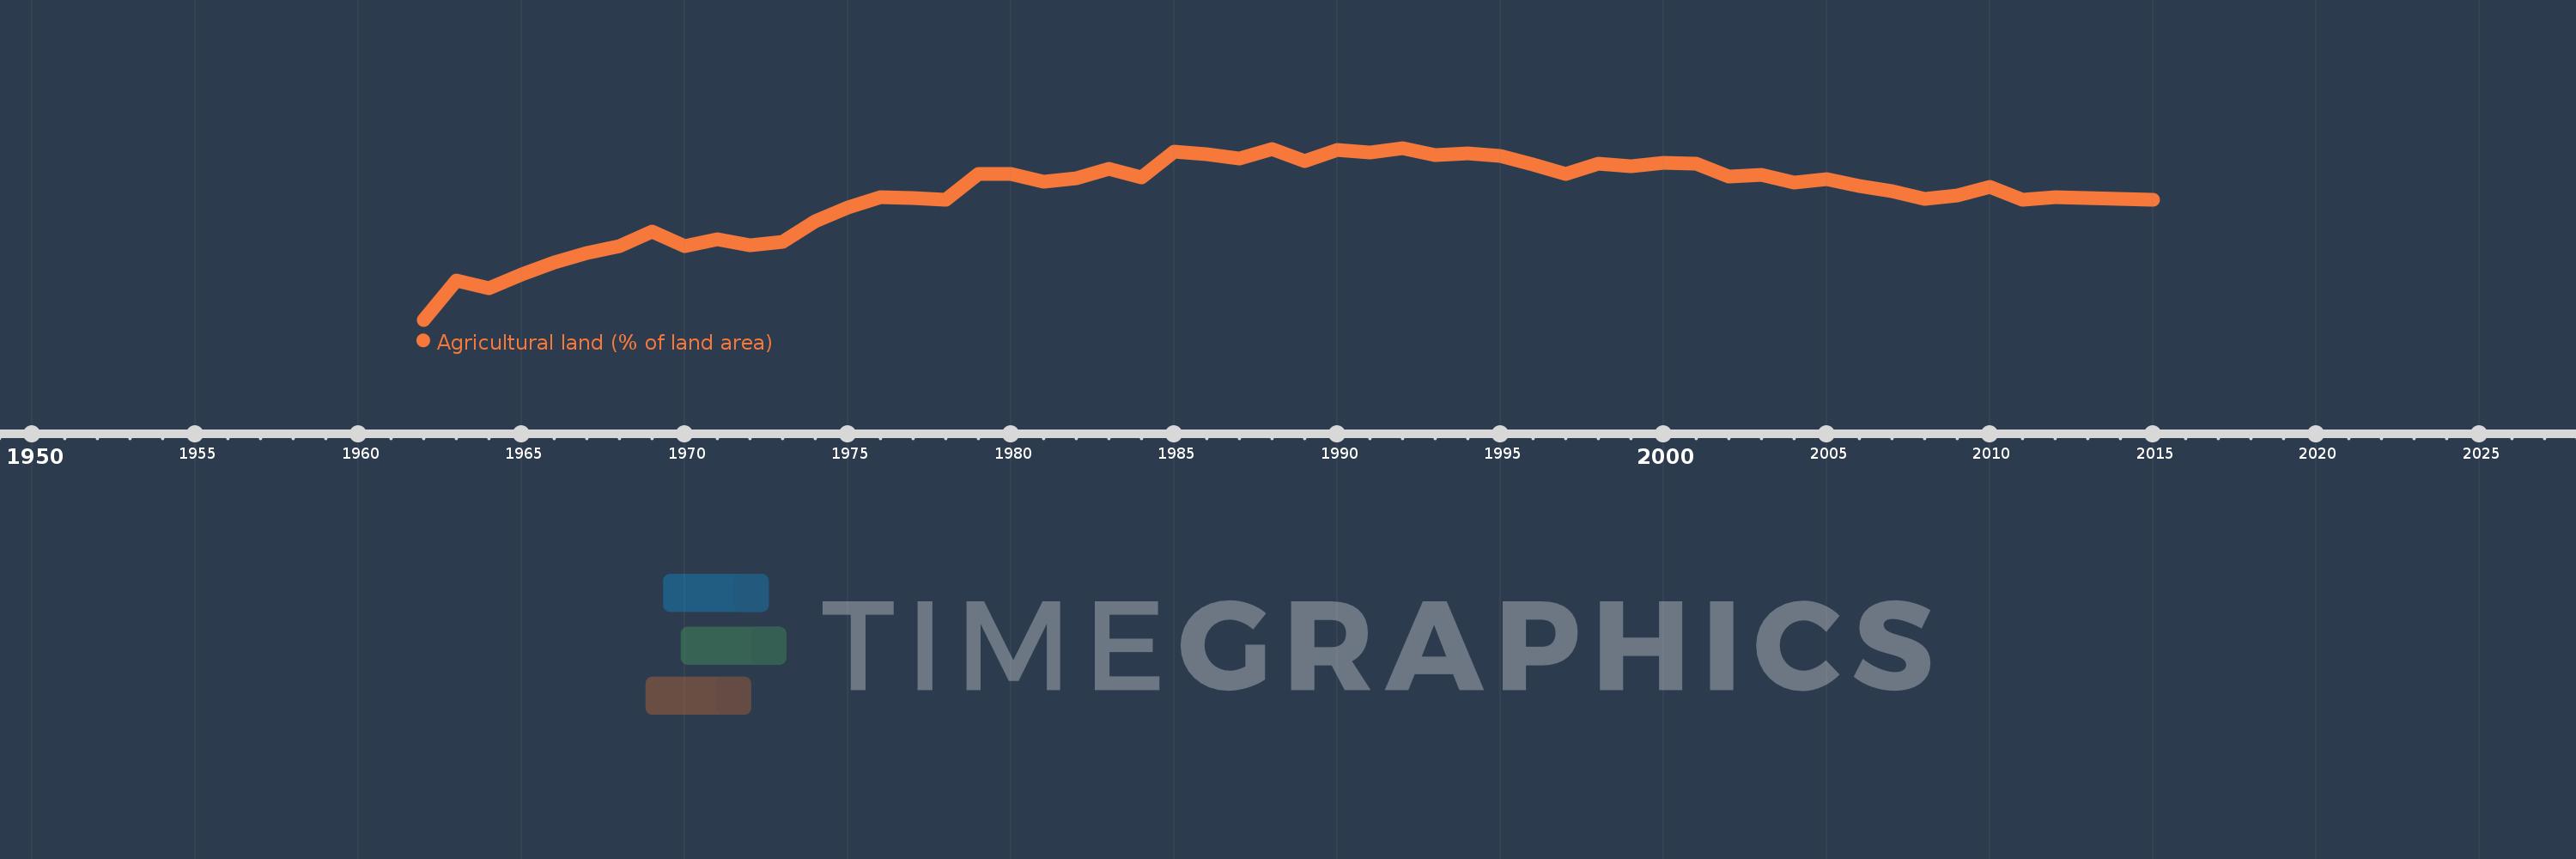
Agricultural land (% of land area)
2015,2014,2013,2012,2011,2010,2009,2008,2007,2006,2005,2004,2003,2002,2001,2000,1999,1998,1997,1996,1995,1994,1993,1992,1991,1990,1989,1988,1987,1986,1985,1984,1983,1982,1981,1980,1979,1978,1977,1976,1975,1974,1973,1972,1971,1970,1969,1968,1967,1966,1965,1964,1963,1962
This statistics in other country:
AfghanistanAlbaniaAlgeriaAmerican SamoaAndorraAngolaAntigua and BarbudaArab WorldArgentinaArmeniaArubaAustraliaAustriaAzerbaijanBahamas, TheBahrainBangladeshBarbadosBelarusBelgiumBelizeBeninBermudaBhutanBoliviaBosnia and HerzegovinaBotswanaBrazilBritish Virgin IslandsBrunei DarussalamBulgariaBurkina FasoBurundiCabo VerdeCambodiaCameroonCanadaCaribbean small statesCayman IslandsCentral African RepublicCentral Europe and the BalticsChadChannel IslandsChileChinaColombiaComorosCongo, Dem. Rep.Congo, Rep.Costa RicaCote d'IvoireCroatiaCubaCyprusCzech RepublicDenmarkDjiboutiDominicaDominican RepublicEarly-demographic dividendEast Asia & PacificEast Asia & Pacific (excluding high income)East Asia & Pacific (IDA & IBRD countries)EcuadorEgypt, Arab Rep.El SalvadorEquatorial GuineaEritreaEstoniaEthiopiaEuro areaEurope & Central AsiaEurope & Central Asia (excluding high income)Europe & Central Asia (IDA & IBRD countries)European UnionFaroe IslandsFijiFinlandFragile and conflict affected situationsFranceFrench PolynesiaGabonGambia, TheGeorgiaGermanyGhanaGreeceGreenlandGrenadaGuamGuatemalaGuineaGuinea-BissauGuyanaHaitiHeavily indebted poor countries (HIPC)High incomeHondurasHong Kong SAR, ChinaHungaryIBRD onlyIcelandIDA & IBRD totalIDA blendIDA onlyIDA totalIndiaIndonesiaIran, Islamic Rep.IraqIrelandIsle of ManIsraelItalyJamaicaJapanJordanKazakhstanKenyaKiribatiKorea, Dem. People’s Rep.Korea, Rep.KosovoKuwaitKyrgyz RepublicLao PDRLate-demographic dividendLatin America & Caribbean Latin America & Caribbean (excluding high income)Latin America & the Caribbean (IDA & IBRD countries)LatviaLeast developed countries: UN classificationLebanonLesothoLiberiaLibyaLiechtensteinLithuaniaLow & middle incomeLow incomeLower middle incomeLuxembourgMacedonia, FYRMadagascarMalawiMalaysiaMaldivesMaliMaltaMarshall IslandsMauritaniaMauritiusMexicoMicronesia, Fed. Sts.Middle East & North AfricaMiddle East & North Africa (excluding high income)Middle East & North Africa (IDA & IBRD countries)Middle incomeMoldovaMongoliaMontenegroMoroccoMozambiqueMyanmarNamibiaNauruNepalNetherlandsNew CaledoniaNew ZealandNicaraguaNigerNigeriaNorth AmericaNorthern Mariana IslandsNorwayOECD membersOmanOther small statesPacific island small statesPakistanPalauPanamaPapua New GuineaParaguayPeruPhilippinesPolandPortugalPost-demographic dividendPre-demographic dividendPuerto RicoQatarRomaniaRussian FederationRwandaSamoaSan MarinoSao Tome and PrincipeSaudi ArabiaSenegalSerbiaSeychellesSierra LeoneSingaporeSlovak RepublicSloveniaSmall statesSolomon IslandsSomaliaSouth AfricaSouth AsiaSouth Asia (IDA & IBRD)SpainSri LankaSt. Kitts and NevisSt. LuciaSt. Vincent and the GrenadinesSub-Saharan Africa Sub-Saharan Africa (excluding high income)Sub-Saharan Africa (IDA & IBRD countries)SudanSurinameSwazilandSwedenSwitzerlandSyrian Arab RepublicTajikistanTanzaniaThailandTimor-LesteTogoTongaTrinidad and TobagoTunisiaTurkeyTurkmenistanTurks and Caicos IslandsTuvaluUgandaUkraineUnited Arab EmiratesUnited KingdomUnited StatesUpper middle incomeUruguayUzbekistanVanuatuVenezuela, RBVietnamVirgin Islands (U.S.)West Bank and GazaWorldYemen, Rep.ZambiaZimbabwe Timeline:
This timeline shows a graph from 1962 to 2015 of India. No data until 1961. Number of actual observations by date: 54.
Source name:
World Development Indicators
Source organization:
Food and Agriculture Organization, electronic files and web site.
Categories, topics:
Agriculture & Rural Development, Climate Change, Environment
Last updated:
apr 23, 2017
Indicators value changes by year
Minimum:
58.843
jan 1, 1962
Maximum:
61.074
jan 1, 1992
At the date of observation
Value
Absolute change
Change from previous value
jan 1, 1962
58.843
+58.843
0.0%
jan 1, 1963
59.358
+0.515
0.87%
jan 1, 1964
59.247
-0.11
-0.19%
jan 1, 1965
59.435
+0.188
0.32%
jan 1, 1966
59.592
+0.156
0.26%
jan 1, 1967
59.71
+0.119
0.2%
jan 1, 1968
59.803
+0.093
0.16%
jan 1, 1969
59.991
+0.187
0.31%
jan 1, 1970
59.798
-0.192
-0.32%
jan 1, 1971
59.886
+0.087
0.15%
jan 1, 1972
59.807
-0.079
-0.13%
jan 1, 1973
59.85
+0.043
0.07%
jan 1, 1974
60.121
+0.271
0.45%
jan 1, 1975
60.3
+0.179
0.3%
jan 1, 1976
60.438
+0.139
0.23%
jan 1, 1977
60.423
-0.015
-0.03%
jan 1, 1978
60.403
-0.02
-0.03%
jan 1, 1979
60.74
+0.337
0.56%
jan 1, 1980
60.736
-0.004
-0.01%
jan 1, 1981
60.633
-0.104
-0.17%
jan 1, 1982
60.676
+0.043
0.07%
jan 1, 1983
60.8
+0.124
0.21%
jan 1, 1984
60.696
-0.104
-0.17%
jan 1, 1985
61.029
+0.333
0.55%
jan 1, 1986
60.992
-0.038
-0.06%
jan 1, 1987
60.942
-0.05
-0.08%
jan 1, 1988
61.06
+0.118
0.19%
jan 1, 1989
60.908
-0.152
-0.25%
jan 1, 1990
61.046
+0.138
0.23%
jan 1, 1991
61.016
-0.03
-0.05%
jan 1, 1992
61.074
+0.058
0.1%
jan 1, 1993
60.98
-0.095
-0.15%
jan 1, 1994
61.006
+0.026
0.04%
jan 1, 1995
60.975
-0.031
-0.05%
jan 1, 1996
60.859
-0.116
-0.19%
jan 1, 1997
60.739
-0.12
-0.2%
jan 1, 1998
60.871
+0.132
0.22%
jan 1, 1999
60.835
-0.036
-0.06%
jan 1, 2000
60.884
+0.049
0.08%
jan 1, 2001
60.869
-0.015
-0.03%
jan 1, 2002
60.705
-0.164
-0.27%
jan 1, 2003
60.729
+0.025
0.04%
jan 1, 2004
60.625
-0.105
-0.17%
jan 1, 2005
60.667
+0.042
0.07%
jan 1, 2006
60.583
-0.084
-0.14%
jan 1, 2007
60.509
-0.074
-0.12%
jan 1, 2008
60.413
-0.096
-0.16%
jan 1, 2009
60.459
+0.046
0.08%
jan 1, 2010
60.564
+0.105
0.17%
jan 1, 2011
60.397
-0.166
-0.27%
jan 1, 2012
60.43
+0.033
0.05%
jan 1, 2013
60.421
-0.009
-0.02%
jan 1, 2014
60.411
-0.01
-0.02%
jan 1, 2015
60.406
-0.004
-0.01%
Ranking of countries by current statistics by years


Comments: