29
/
en
AIzaSyAYiBZKx7MnpbEhh9jyipgxe19OcubqV5w
April 1, 2024
93215
Bulgaria
BGR
true
2
1
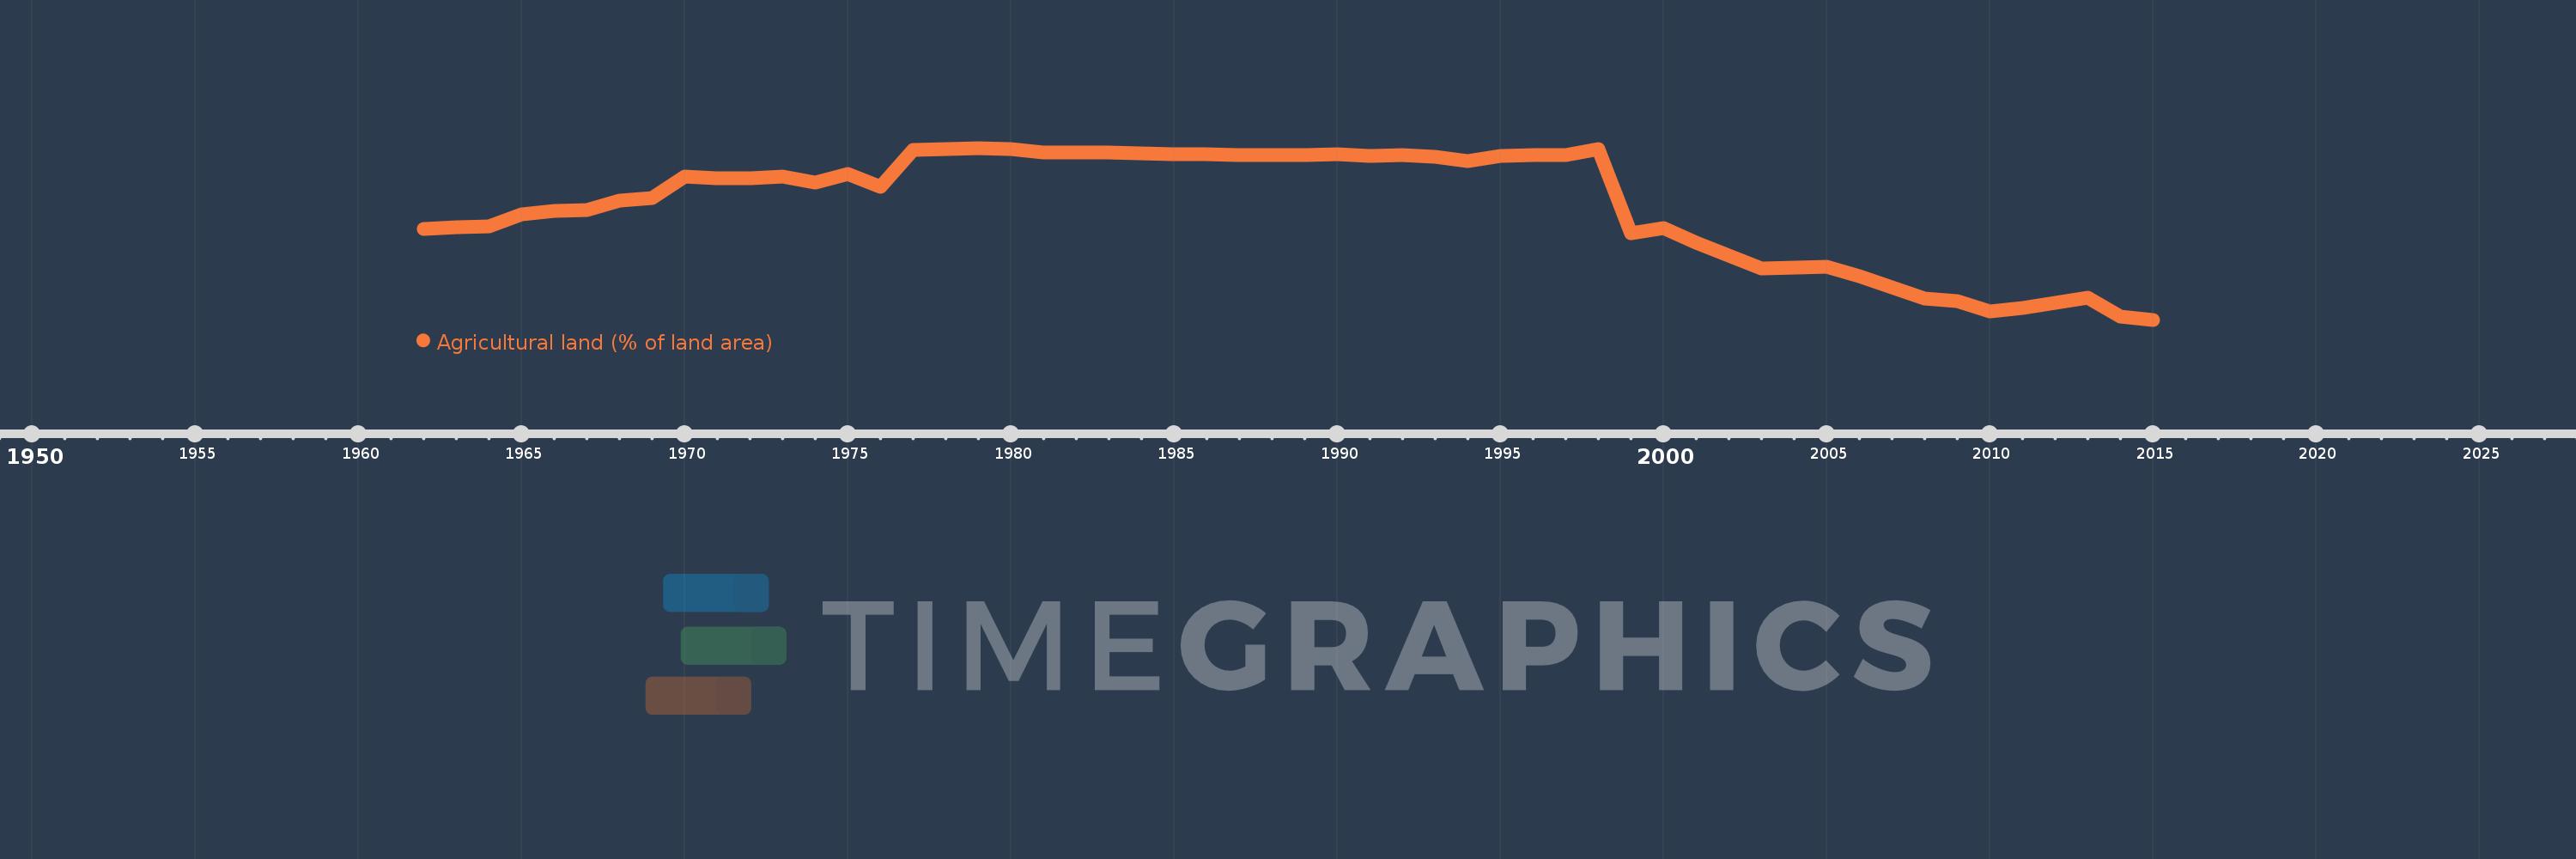
Agricultural land (% of land area)
2015,2014,2013,2012,2011,2010,2009,2008,2007,2006,2005,2004,2003,2002,2001,2000,1999,1998,1997,1996,1995,1994,1993,1992,1991,1990,1989,1988,1987,1986,1985,1984,1983,1982,1981,1980,1979,1978,1977,1976,1975,1974,1973,1972,1971,1970,1969,1968,1967,1966,1965,1964,1963,1962
This statistics in other country:
AfghanistanAlbaniaAlgeriaAmerican SamoaAndorraAngolaAntigua and BarbudaArab WorldArgentinaArmeniaArubaAustraliaAustriaAzerbaijanBahamas, TheBahrainBangladeshBarbadosBelarusBelgiumBelizeBeninBermudaBhutanBoliviaBosnia and HerzegovinaBotswanaBrazilBritish Virgin IslandsBrunei DarussalamBulgariaBurkina FasoBurundiCabo VerdeCambodiaCameroonCanadaCaribbean small statesCayman IslandsCentral African RepublicCentral Europe and the BalticsChadChannel IslandsChileChinaColombiaComorosCongo, Dem. Rep.Congo, Rep.Costa RicaCote d'IvoireCroatiaCubaCyprusCzech RepublicDenmarkDjiboutiDominicaDominican RepublicEarly-demographic dividendEast Asia & PacificEast Asia & Pacific (excluding high income)East Asia & Pacific (IDA & IBRD countries)EcuadorEgypt, Arab Rep.El SalvadorEquatorial GuineaEritreaEstoniaEthiopiaEuro areaEurope & Central AsiaEurope & Central Asia (excluding high income)Europe & Central Asia (IDA & IBRD countries)European UnionFaroe IslandsFijiFinlandFragile and conflict affected situationsFranceFrench PolynesiaGabonGambia, TheGeorgiaGermanyGhanaGreeceGreenlandGrenadaGuamGuatemalaGuineaGuinea-BissauGuyanaHaitiHeavily indebted poor countries (HIPC)High incomeHondurasHong Kong SAR, ChinaHungaryIBRD onlyIcelandIDA & IBRD totalIDA blendIDA onlyIDA totalIndiaIndonesiaIran, Islamic Rep.IraqIrelandIsle of ManIsraelItalyJamaicaJapanJordanKazakhstanKenyaKiribatiKorea, Dem. People’s Rep.Korea, Rep.KosovoKuwaitKyrgyz RepublicLao PDRLate-demographic dividendLatin America & Caribbean Latin America & Caribbean (excluding high income)Latin America & the Caribbean (IDA & IBRD countries)LatviaLeast developed countries: UN classificationLebanonLesothoLiberiaLibyaLiechtensteinLithuaniaLow & middle incomeLow incomeLower middle incomeLuxembourgMacedonia, FYRMadagascarMalawiMalaysiaMaldivesMaliMaltaMarshall IslandsMauritaniaMauritiusMexicoMicronesia, Fed. Sts.Middle East & North AfricaMiddle East & North Africa (excluding high income)Middle East & North Africa (IDA & IBRD countries)Middle incomeMoldovaMongoliaMontenegroMoroccoMozambiqueMyanmarNamibiaNauruNepalNetherlandsNew CaledoniaNew ZealandNicaraguaNigerNigeriaNorth AmericaNorthern Mariana IslandsNorwayOECD membersOmanOther small statesPacific island small statesPakistanPalauPanamaPapua New GuineaParaguayPeruPhilippinesPolandPortugalPost-demographic dividendPre-demographic dividendPuerto RicoQatarRomaniaRussian FederationRwandaSamoaSan MarinoSao Tome and PrincipeSaudi ArabiaSenegalSerbiaSeychellesSierra LeoneSingaporeSlovak RepublicSloveniaSmall statesSolomon IslandsSomaliaSouth AfricaSouth AsiaSouth Asia (IDA & IBRD)SpainSri LankaSt. Kitts and NevisSt. LuciaSt. Vincent and the GrenadinesSub-Saharan Africa Sub-Saharan Africa (excluding high income)Sub-Saharan Africa (IDA & IBRD countries)SudanSurinameSwazilandSwedenSwitzerlandSyrian Arab RepublicTajikistanTanzaniaThailandTimor-LesteTogoTongaTrinidad and TobagoTunisiaTurkeyTurkmenistanTurks and Caicos IslandsTuvaluUgandaUkraineUnited Arab EmiratesUnited KingdomUnited StatesUpper middle incomeUruguayUzbekistanVanuatuVenezuela, RBVietnamVirgin Islands (U.S.)West Bank and GazaWorldYemen, Rep.ZambiaZimbabwe Timeline:
This timeline shows a graph from 1962 to 2015 of Bulgaria. No data until 1961. Number of actual observations by date: 54.
Source name:
World Development Indicators
Source organization:
Food and Agriculture Organization, electronic files and web site.
Categories, topics:
Agriculture & Rural Development, Climate Change, Environment
Last updated:
apr 23, 2017
Indicators value changes by year
Minimum:
45.846
jan 1, 2015
Maximum:
56.142
jan 1, 1979
At the date of observation
Value
Absolute change
Change from previous value
jan 1, 1962
51.279
+51.279
0.0%
jan 1, 1963
51.388
+0.108
0.21%
jan 1, 1964
51.46
+0.072
0.14%
jan 1, 1965
52.174
+0.714
1.39%
jan 1, 1966
52.364
+0.19
0.36%
jan 1, 1967
52.445
+0.081
0.16%
jan 1, 1968
52.996
+0.551
1.05%
jan 1, 1969
53.159
+0.163
0.31%
jan 1, 1970
54.434
+1.275
2.4%
jan 1, 1971
54.325
-0.108
-0.2%
jan 1, 1972
54.316
-0.009
-0.02%
jan 1, 1973
54.434
+0.118
0.22%
jan 1, 1974
54.072
-0.362
-0.66%
jan 1, 1975
54.578
+0.506
0.94%
jan 1, 1976
53.828
-0.75
-1.37%
jan 1, 1977
56.025
+2.197
4.08%
jan 1, 1978
56.097
+0.072
0.13%
jan 1, 1979
56.142
+0.045
0.08%
jan 1, 1980
56.097
-0.045
-0.08%
jan 1, 1981
55.871
-0.226
-0.4%
jan 1, 1982
55.853
-0.018
-0.03%
jan 1, 1983
55.88
+0.027
0.05%
jan 1, 1984
55.835
-0.045
-0.08%
jan 1, 1985
55.79
-0.045
-0.08%
jan 1, 1986
55.762
-0.027
-0.05%
jan 1, 1987
55.735
-0.027
-0.05%
jan 1, 1988
55.735
0.0
0.0%
jan 1, 1989
55.699
-0.036
-0.06%
jan 1, 1990
55.753
+0.054
0.1%
jan 1, 1991
55.672
-0.081
-0.15%
jan 1, 1992
55.69
+0.018
0.03%
jan 1, 1993
55.627
-0.063
-0.11%
jan 1, 1994
55.329
-0.298
-0.54%
jan 1, 1995
55.672
+0.343
0.62%
jan 1, 1996
55.717
+0.045
0.08%
jan 1, 1997
55.717
0.0
0.0%
jan 1, 1998
56.07
+0.353
0.63%
jan 1, 1999
51.026
-5.044
-9.0%
jan 1, 2000
51.333
+0.307
0.6%
jan 1, 2001
50.456
-0.877
-1.71%
jan 1, 2002
49.697
-0.759
-1.5%
jan 1, 2003
48.943
-0.754
-1.52%
jan 1, 2004
48.966
+0.023
0.05%
jan 1, 2005
49.007
+0.041
0.08%
jan 1, 2006
48.463
-0.544
-1.11%
jan 1, 2007
47.777
-0.686
-1.42%
jan 1, 2008
47.104
-0.673
-1.41%
jan 1, 2009
46.966
-0.138
-0.29%
jan 1, 2010
46.334
-0.632
-1.35%
jan 1, 2011
46.536
+0.203
0.44%
jan 1, 2012
46.868
+0.332
0.71%
jan 1, 2013
47.19
+0.322
0.69%
jan 1, 2014
46.011
-1.179
-2.5%
jan 1, 2015
45.846
-0.166
-0.36%
Ranking of countries by current statistics by years


Comments: