29
/
en
AIzaSyAYiBZKx7MnpbEhh9jyipgxe19OcubqV5w
April 1, 2024
187435
Malaysia
MYS
true
2
1
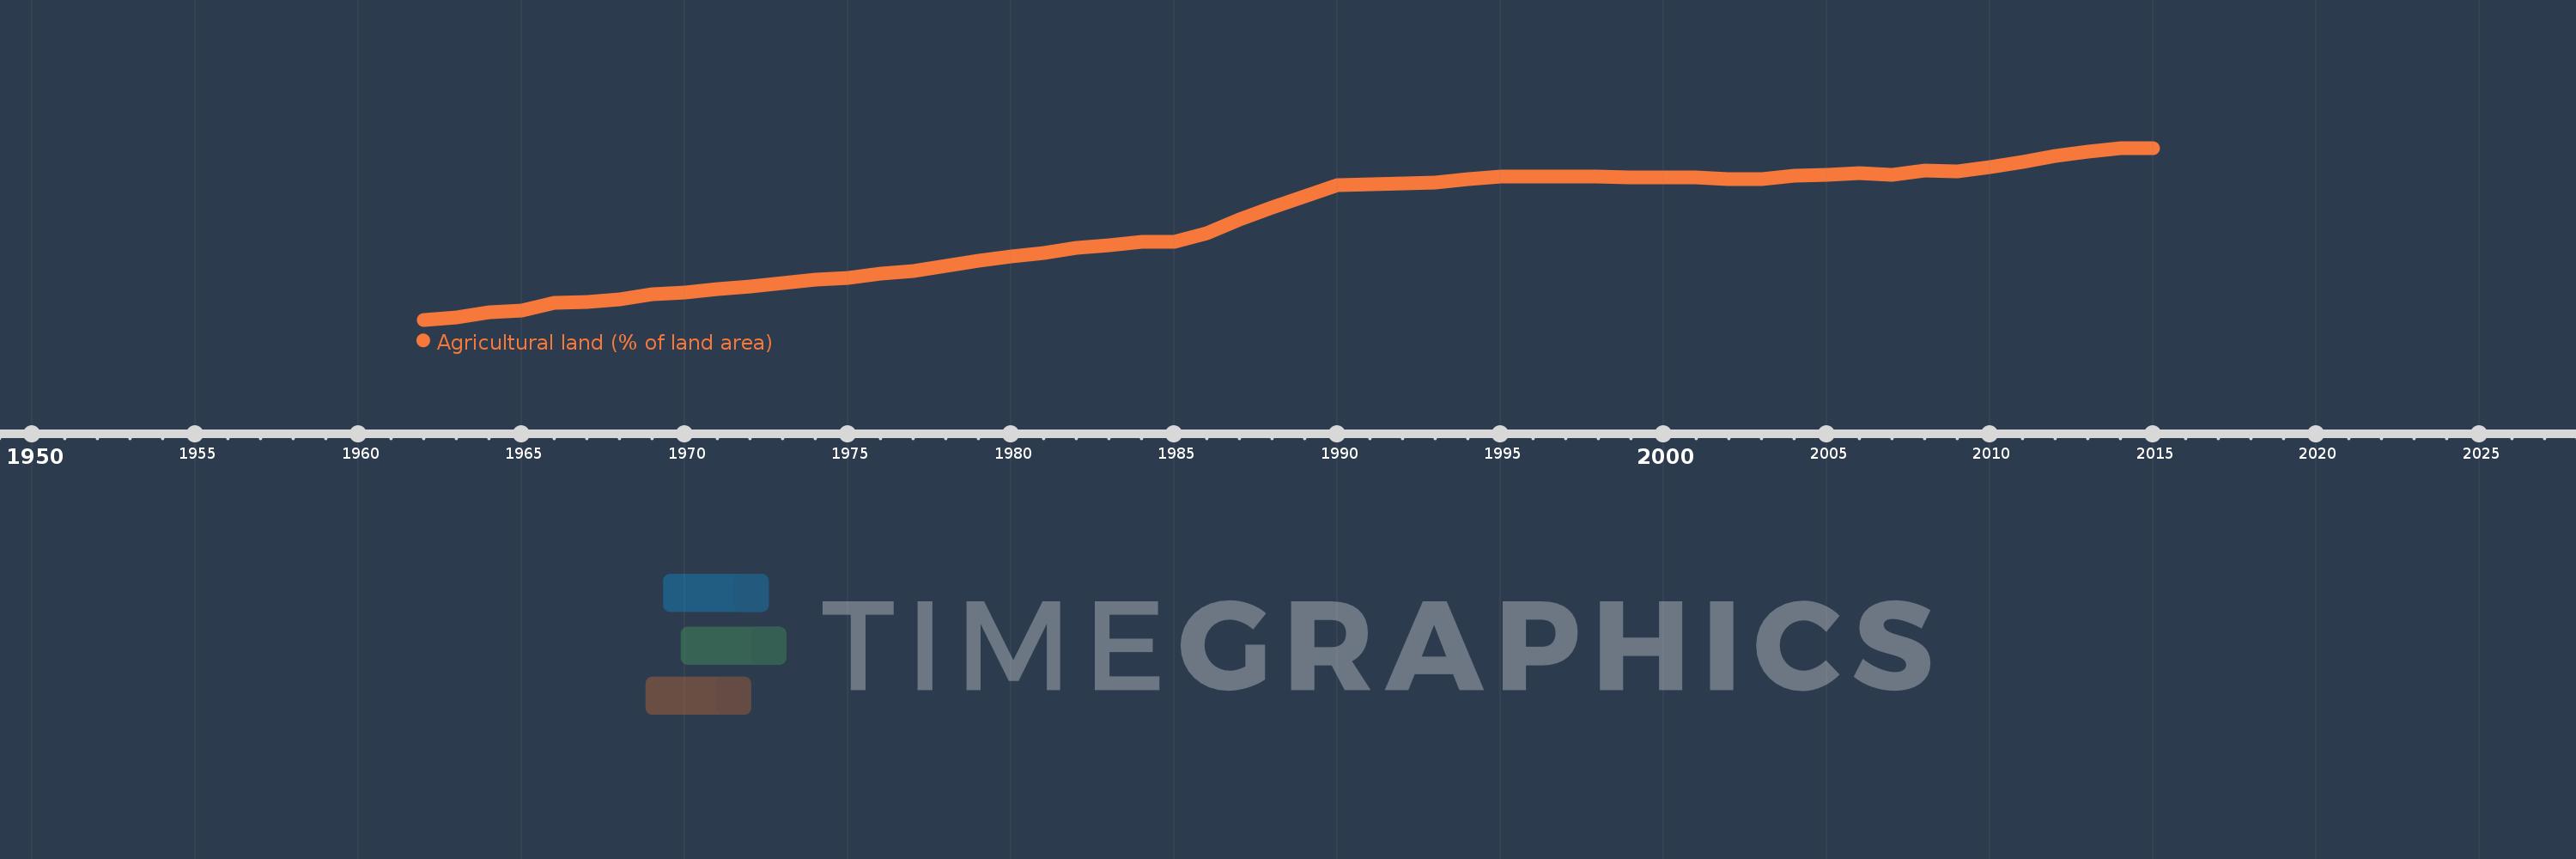
Agricultural land (% of land area)
2015,2014,2013,2012,2011,2010,2009,2008,2007,2006,2005,2004,2003,2002,2001,2000,1999,1998,1997,1996,1995,1994,1993,1992,1991,1990,1989,1988,1987,1986,1985,1984,1983,1982,1981,1980,1979,1978,1977,1976,1975,1974,1973,1972,1971,1970,1969,1968,1967,1966,1965,1964,1963,1962
This statistics in other country:
AfghanistanAlbaniaAlgeriaAmerican SamoaAndorraAngolaAntigua and BarbudaArab WorldArgentinaArmeniaArubaAustraliaAustriaAzerbaijanBahamas, TheBahrainBangladeshBarbadosBelarusBelgiumBelizeBeninBermudaBhutanBoliviaBosnia and HerzegovinaBotswanaBrazilBritish Virgin IslandsBrunei DarussalamBulgariaBurkina FasoBurundiCabo VerdeCambodiaCameroonCanadaCaribbean small statesCayman IslandsCentral African RepublicCentral Europe and the BalticsChadChannel IslandsChileChinaColombiaComorosCongo, Dem. Rep.Congo, Rep.Costa RicaCote d'IvoireCroatiaCubaCyprusCzech RepublicDenmarkDjiboutiDominicaDominican RepublicEarly-demographic dividendEast Asia & PacificEast Asia & Pacific (excluding high income)East Asia & Pacific (IDA & IBRD countries)EcuadorEgypt, Arab Rep.El SalvadorEquatorial GuineaEritreaEstoniaEthiopiaEuro areaEurope & Central AsiaEurope & Central Asia (excluding high income)Europe & Central Asia (IDA & IBRD countries)European UnionFaroe IslandsFijiFinlandFragile and conflict affected situationsFranceFrench PolynesiaGabonGambia, TheGeorgiaGermanyGhanaGreeceGreenlandGrenadaGuamGuatemalaGuineaGuinea-BissauGuyanaHaitiHeavily indebted poor countries (HIPC)High incomeHondurasHong Kong SAR, ChinaHungaryIBRD onlyIcelandIDA & IBRD totalIDA blendIDA onlyIDA totalIndiaIndonesiaIran, Islamic Rep.IraqIrelandIsle of ManIsraelItalyJamaicaJapanJordanKazakhstanKenyaKiribatiKorea, Dem. People’s Rep.Korea, Rep.KosovoKuwaitKyrgyz RepublicLao PDRLate-demographic dividendLatin America & Caribbean Latin America & Caribbean (excluding high income)Latin America & the Caribbean (IDA & IBRD countries)LatviaLeast developed countries: UN classificationLebanonLesothoLiberiaLibyaLiechtensteinLithuaniaLow & middle incomeLow incomeLower middle incomeLuxembourgMacedonia, FYRMadagascarMalawiMalaysiaMaldivesMaliMaltaMarshall IslandsMauritaniaMauritiusMexicoMicronesia, Fed. Sts.Middle East & North AfricaMiddle East & North Africa (excluding high income)Middle East & North Africa (IDA & IBRD countries)Middle incomeMoldovaMongoliaMontenegroMoroccoMozambiqueMyanmarNamibiaNauruNepalNetherlandsNew CaledoniaNew ZealandNicaraguaNigerNigeriaNorth AmericaNorthern Mariana IslandsNorwayOECD membersOmanOther small statesPacific island small statesPakistanPalauPanamaPapua New GuineaParaguayPeruPhilippinesPolandPortugalPost-demographic dividendPre-demographic dividendPuerto RicoQatarRomaniaRussian FederationRwandaSamoaSan MarinoSao Tome and PrincipeSaudi ArabiaSenegalSerbiaSeychellesSierra LeoneSingaporeSlovak RepublicSloveniaSmall statesSolomon IslandsSomaliaSouth AfricaSouth AsiaSouth Asia (IDA & IBRD)SpainSri LankaSt. Kitts and NevisSt. LuciaSt. Vincent and the GrenadinesSub-Saharan Africa Sub-Saharan Africa (excluding high income)Sub-Saharan Africa (IDA & IBRD countries)SudanSurinameSwazilandSwedenSwitzerlandSyrian Arab RepublicTajikistanTanzaniaThailandTimor-LesteTogoTongaTrinidad and TobagoTunisiaTurkeyTurkmenistanTurks and Caicos IslandsTuvaluUgandaUkraineUnited Arab EmiratesUnited KingdomUnited StatesUpper middle incomeUruguayUzbekistanVanuatuVenezuela, RBVietnamVirgin Islands (U.S.)West Bank and GazaWorldYemen, Rep.ZambiaZimbabwe Timeline:
This timeline shows a graph from 1962 to 2015 of Malaysia. No data until 1961. Number of actual observations by date: 54.
Source name:
World Development Indicators
Source organization:
Food and Agriculture Organization, electronic files and web site.
Categories, topics:
Agriculture & Rural Development, Climate Change, Environment
Last updated:
apr 23, 2017
Indicators value changes by year
Maximum:
23.859
jan 1, 2014
At the date of observation
Value
Absolute change
Change from previous value
jan 1, 1962
9.492
+9.492
0.0%
jan 1, 1963
9.703
+0.211
2.22%
jan 1, 1964
10.087
+0.385
3.97%
jan 1, 1965
10.278
+0.191
1.89%
jan 1, 1966
10.94
+0.662
6.44%
jan 1, 1967
10.964
+0.023
0.21%
jan 1, 1968
11.163
+0.199
1.82%
jan 1, 1969
11.592
+0.429
3.85%
jan 1, 1970
11.763
+0.171
1.48%
jan 1, 1971
12.045
+0.282
2.4%
jan 1, 1972
12.28
+0.235
1.95%
jan 1, 1973
12.58
+0.3
2.44%
jan 1, 1974
12.828
+0.248
1.97%
jan 1, 1975
13.01
+0.182
1.42%
jan 1, 1976
13.345
+0.335
2.57%
jan 1, 1977
13.594
+0.25
1.87%
jan 1, 1978
13.996
+0.402
2.96%
jan 1, 1979
14.457
+0.461
3.3%
jan 1, 1980
14.814
+0.357
2.47%
jan 1, 1981
15.102
+0.287
1.94%
jan 1, 1982
15.526
+0.424
2.81%
jan 1, 1983
15.71
+0.184
1.18%
jan 1, 1984
16.006
+0.296
1.89%
jan 1, 1985
16.03
+0.025
0.15%
jan 1, 1986
16.755
+0.725
4.52%
jan 1, 1987
17.84
+1.085
6.47%
jan 1, 1988
18.886
+1.046
5.86%
jan 1, 1989
19.796
+0.91
4.82%
jan 1, 1990
20.782
+0.986
4.98%
jan 1, 1991
20.836
+0.054
0.26%
jan 1, 1992
20.928
+0.092
0.44%
jan 1, 1993
20.955
+0.027
0.13%
jan 1, 1994
21.241
+0.286
1.36%
jan 1, 1995
21.492
+0.251
1.18%
jan 1, 1996
21.463
-0.029
-0.14%
jan 1, 1997
21.495
+0.032
0.15%
jan 1, 1998
21.475
-0.02
-0.09%
jan 1, 1999
21.418
-0.057
-0.27%
jan 1, 2000
21.37
-0.048
-0.23%
jan 1, 2001
21.371
+0.001
0.0%
jan 1, 2002
21.257
-0.114
-0.53%
jan 1, 2003
21.282
+0.025
0.12%
jan 1, 2004
21.555
+0.273
1.28%
jan 1, 2005
21.619
+0.064
0.3%
jan 1, 2006
21.74
+0.121
0.56%
jan 1, 2007
21.646
-0.094
-0.43%
jan 1, 2008
21.962
+0.316
1.46%
jan 1, 2009
21.917
-0.044
-0.2%
jan 1, 2010
22.228
+0.311
1.42%
jan 1, 2011
22.724
+0.496
2.23%
jan 1, 2012
23.19
+0.466
2.05%
jan 1, 2013
23.543
+0.353
1.52%
jan 1, 2014
23.859
+0.317
1.34%
jan 1, 2015
23.859
0.0
0.0%
Ranking of countries by current statistics by years


Comments: