29
/
en
AIzaSyAYiBZKx7MnpbEhh9jyipgxe19OcubqV5w
April 1, 2024
111845
Costa Rica
CRI
true
2
1
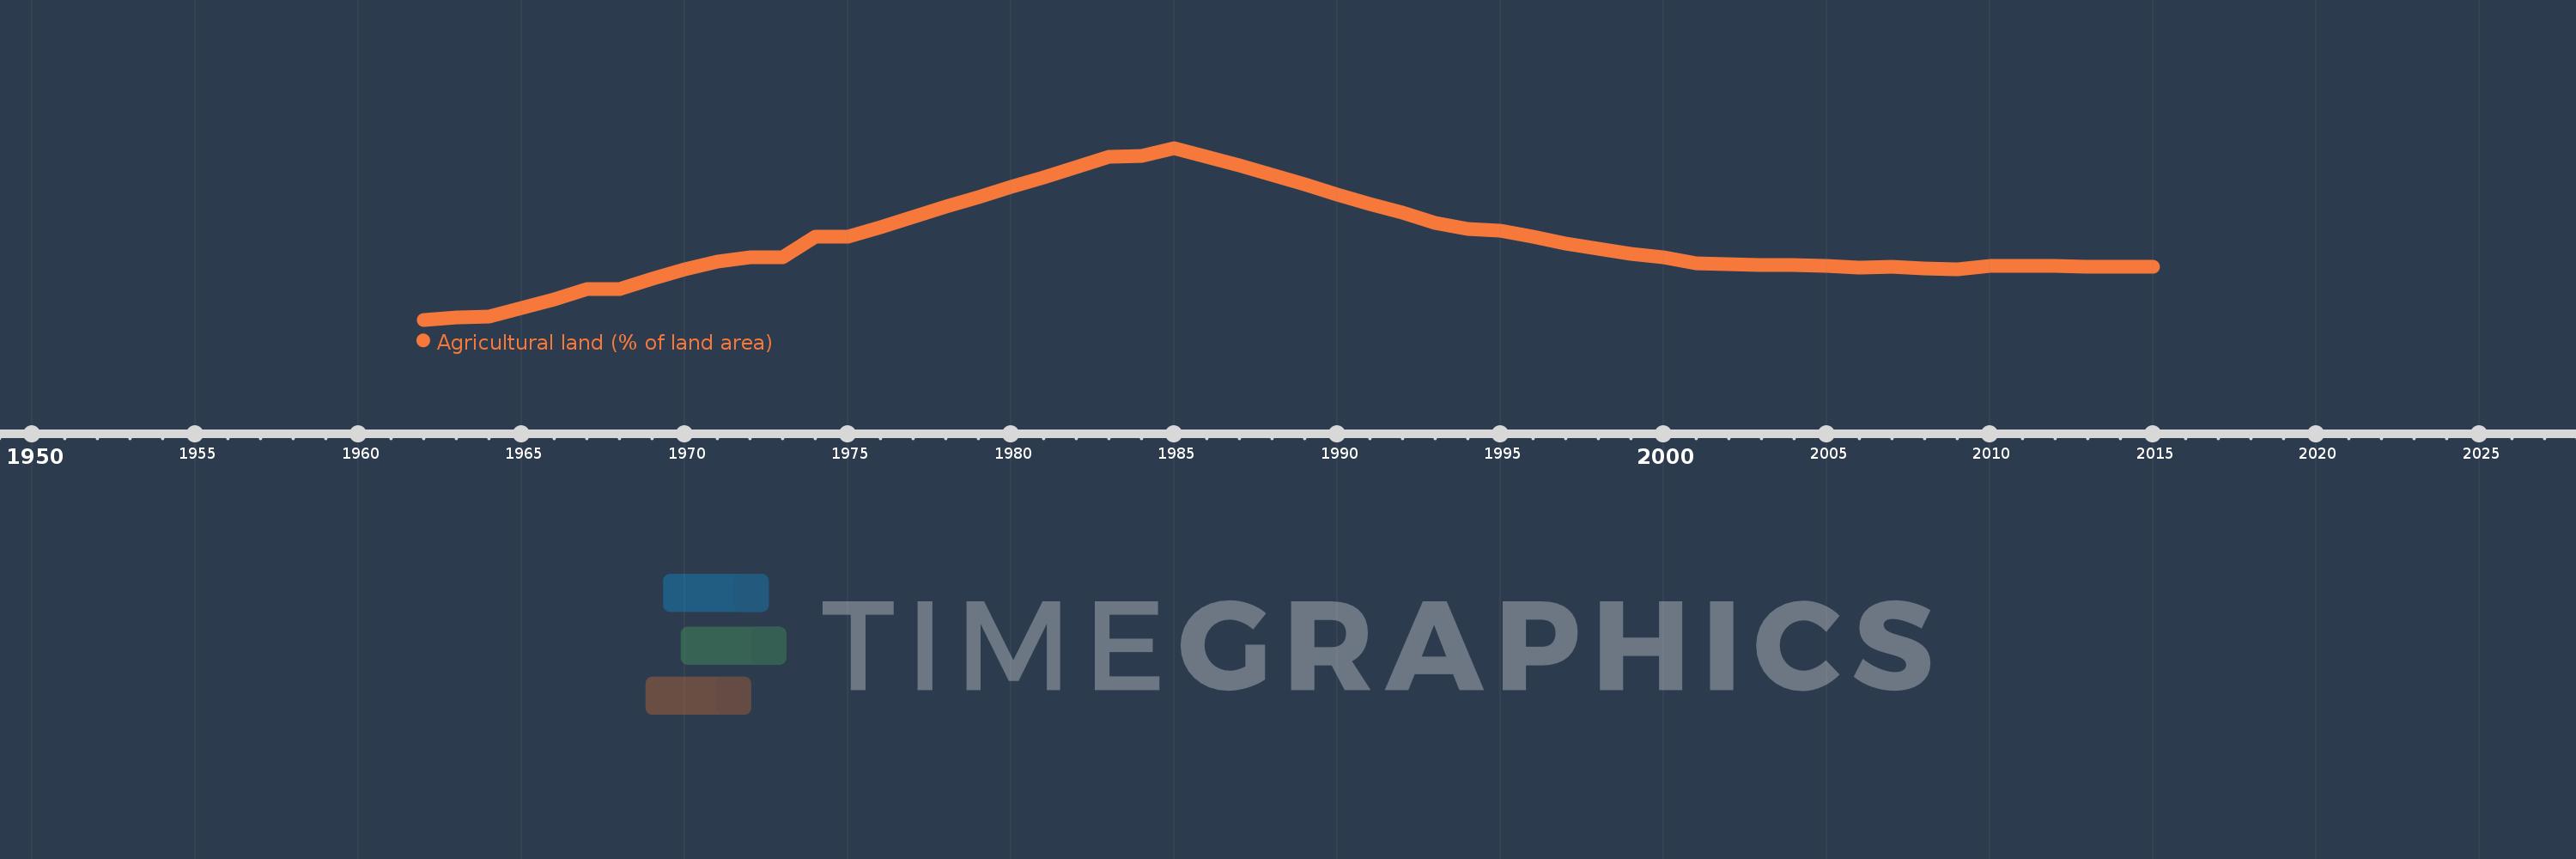
Agricultural land (% of land area)
2015,2014,2013,2012,2011,2010,2009,2008,2007,2006,2005,2004,2003,2002,2001,2000,1999,1998,1997,1996,1995,1994,1993,1992,1991,1990,1989,1988,1987,1986,1985,1984,1983,1982,1981,1980,1979,1978,1977,1976,1975,1974,1973,1972,1971,1970,1969,1968,1967,1966,1965,1964,1963,1962
This statistics in other country:
AfghanistanAlbaniaAlgeriaAmerican SamoaAndorraAngolaAntigua and BarbudaArab WorldArgentinaArmeniaArubaAustraliaAustriaAzerbaijanBahamas, TheBahrainBangladeshBarbadosBelarusBelgiumBelizeBeninBermudaBhutanBoliviaBosnia and HerzegovinaBotswanaBrazilBritish Virgin IslandsBrunei DarussalamBulgariaBurkina FasoBurundiCabo VerdeCambodiaCameroonCanadaCaribbean small statesCayman IslandsCentral African RepublicCentral Europe and the BalticsChadChannel IslandsChileChinaColombiaComorosCongo, Dem. Rep.Congo, Rep.Costa RicaCote d'IvoireCroatiaCubaCyprusCzech RepublicDenmarkDjiboutiDominicaDominican RepublicEarly-demographic dividendEast Asia & PacificEast Asia & Pacific (excluding high income)East Asia & Pacific (IDA & IBRD countries)EcuadorEgypt, Arab Rep.El SalvadorEquatorial GuineaEritreaEstoniaEthiopiaEuro areaEurope & Central AsiaEurope & Central Asia (excluding high income)Europe & Central Asia (IDA & IBRD countries)European UnionFaroe IslandsFijiFinlandFragile and conflict affected situationsFranceFrench PolynesiaGabonGambia, TheGeorgiaGermanyGhanaGreeceGreenlandGrenadaGuamGuatemalaGuineaGuinea-BissauGuyanaHaitiHeavily indebted poor countries (HIPC)High incomeHondurasHong Kong SAR, ChinaHungaryIBRD onlyIcelandIDA & IBRD totalIDA blendIDA onlyIDA totalIndiaIndonesiaIran, Islamic Rep.IraqIrelandIsle of ManIsraelItalyJamaicaJapanJordanKazakhstanKenyaKiribatiKorea, Dem. People’s Rep.Korea, Rep.KosovoKuwaitKyrgyz RepublicLao PDRLate-demographic dividendLatin America & Caribbean Latin America & Caribbean (excluding high income)Latin America & the Caribbean (IDA & IBRD countries)LatviaLeast developed countries: UN classificationLebanonLesothoLiberiaLibyaLiechtensteinLithuaniaLow & middle incomeLow incomeLower middle incomeLuxembourgMacedonia, FYRMadagascarMalawiMalaysiaMaldivesMaliMaltaMarshall IslandsMauritaniaMauritiusMexicoMicronesia, Fed. Sts.Middle East & North AfricaMiddle East & North Africa (excluding high income)Middle East & North Africa (IDA & IBRD countries)Middle incomeMoldovaMongoliaMontenegroMoroccoMozambiqueMyanmarNamibiaNauruNepalNetherlandsNew CaledoniaNew ZealandNicaraguaNigerNigeriaNorth AmericaNorthern Mariana IslandsNorwayOECD membersOmanOther small statesPacific island small statesPakistanPalauPanamaPapua New GuineaParaguayPeruPhilippinesPolandPortugalPost-demographic dividendPre-demographic dividendPuerto RicoQatarRomaniaRussian FederationRwandaSamoaSan MarinoSao Tome and PrincipeSaudi ArabiaSenegalSerbiaSeychellesSierra LeoneSingaporeSlovak RepublicSloveniaSmall statesSolomon IslandsSomaliaSouth AfricaSouth AsiaSouth Asia (IDA & IBRD)SpainSri LankaSt. Kitts and NevisSt. LuciaSt. Vincent and the GrenadinesSub-Saharan Africa Sub-Saharan Africa (excluding high income)Sub-Saharan Africa (IDA & IBRD countries)SudanSurinameSwazilandSwedenSwitzerlandSyrian Arab RepublicTajikistanTanzaniaThailandTimor-LesteTogoTongaTrinidad and TobagoTunisiaTurkeyTurkmenistanTurks and Caicos IslandsTuvaluUgandaUkraineUnited Arab EmiratesUnited KingdomUnited StatesUpper middle incomeUruguayUzbekistanVanuatuVenezuela, RBVietnamVirgin Islands (U.S.)West Bank and GazaWorldYemen, Rep.ZambiaZimbabwe Timeline:
This timeline shows a graph from 1962 to 2015 of Costa Rica. No data until 1961. Number of actual observations by date: 54.
Source name:
World Development Indicators
Source organization:
Food and Agriculture Organization, electronic files and web site.
Categories, topics:
Agriculture & Rural Development, Climate Change, Environment
Last updated:
apr 23, 2017
Indicators value changes by year
Minimum:
27.321
jan 1, 1962
Maximum:
53.819
jan 1, 1985
At the date of observation
Value
Absolute change
Change from previous value
jan 1, 1962
27.321
+27.321
0.0%
jan 1, 1963
27.615
+0.294
1.08%
jan 1, 1964
27.81
+0.196
0.71%
jan 1, 1965
29.083
+1.273
4.58%
jan 1, 1966
30.454
+1.371
4.71%
jan 1, 1967
32.021
+1.567
5.14%
jan 1, 1968
32.041
+0.02
0.06%
jan 1, 1969
33.608
+1.567
4.89%
jan 1, 1970
35.057
+1.449
4.31%
jan 1, 1971
36.349
+1.293
3.69%
jan 1, 1972
36.957
+0.607
1.67%
jan 1, 1973
36.957
0.0
0.0%
jan 1, 1974
40.11
+3.153
8.53%
jan 1, 1975
40.11
0.0
0.0%
jan 1, 1976
41.559
+1.449
3.61%
jan 1, 1977
43.184
+1.626
3.91%
jan 1, 1978
44.79
+1.606
3.72%
jan 1, 1979
46.22
+1.43
3.19%
jan 1, 1980
47.846
+1.626
3.52%
jan 1, 1981
49.275
+1.43
2.99%
jan 1, 1982
50.901
+1.626
3.3%
jan 1, 1983
52.468
+1.567
3.08%
jan 1, 1984
52.526
+0.059
0.11%
jan 1, 1985
53.819
+1.293
2.46%
jan 1, 1986
52.507
-1.312
-2.44%
jan 1, 1987
51.156
-1.351
-2.57%
jan 1, 1988
49.726
-1.43
-2.79%
jan 1, 1989
48.237
-1.488
-2.99%
jan 1, 1990
46.573
-1.665
-3.45%
jan 1, 1991
45.143
-1.43
-3.07%
jan 1, 1992
43.831
-1.312
-2.91%
jan 1, 1993
42.303
-1.528
-3.49%
jan 1, 1994
41.383
-0.92
-2.18%
jan 1, 1995
41.03
-0.353
-0.85%
jan 1, 1996
40.11
-0.92
-2.24%
jan 1, 1997
39.072
-1.038
-2.59%
jan 1, 1998
38.249
-0.823
-2.11%
jan 1, 1999
37.505
-0.744
-1.95%
jan 1, 2000
36.976
-0.529
-1.41%
jan 1, 2001
36.036
-0.94
-2.54%
jan 1, 2002
35.899
-0.137
-0.38%
jan 1, 2003
35.762
-0.137
-0.38%
jan 1, 2004
35.821
+0.059
0.16%
jan 1, 2005
35.684
-0.137
-0.38%
jan 1, 2006
35.351
-0.333
-0.93%
jan 1, 2007
35.546
+0.196
0.55%
jan 1, 2008
35.253
-0.294
-0.83%
jan 1, 2009
35.116
-0.137
-0.39%
jan 1, 2010
35.566
+0.45
1.28%
jan 1, 2011
35.625
+0.059
0.17%
jan 1, 2012
35.625
0.0
0.0%
jan 1, 2013
35.488
-0.137
-0.38%
jan 1, 2014
35.478
-0.01
-0.03%
jan 1, 2015
35.47
-0.008
-0.02%
Ranking of countries by current statistics by years


Comments: