29
/
en
AIzaSyAYiBZKx7MnpbEhh9jyipgxe19OcubqV5w
April 1, 2024
261848
Thailand
THA
true
2
1
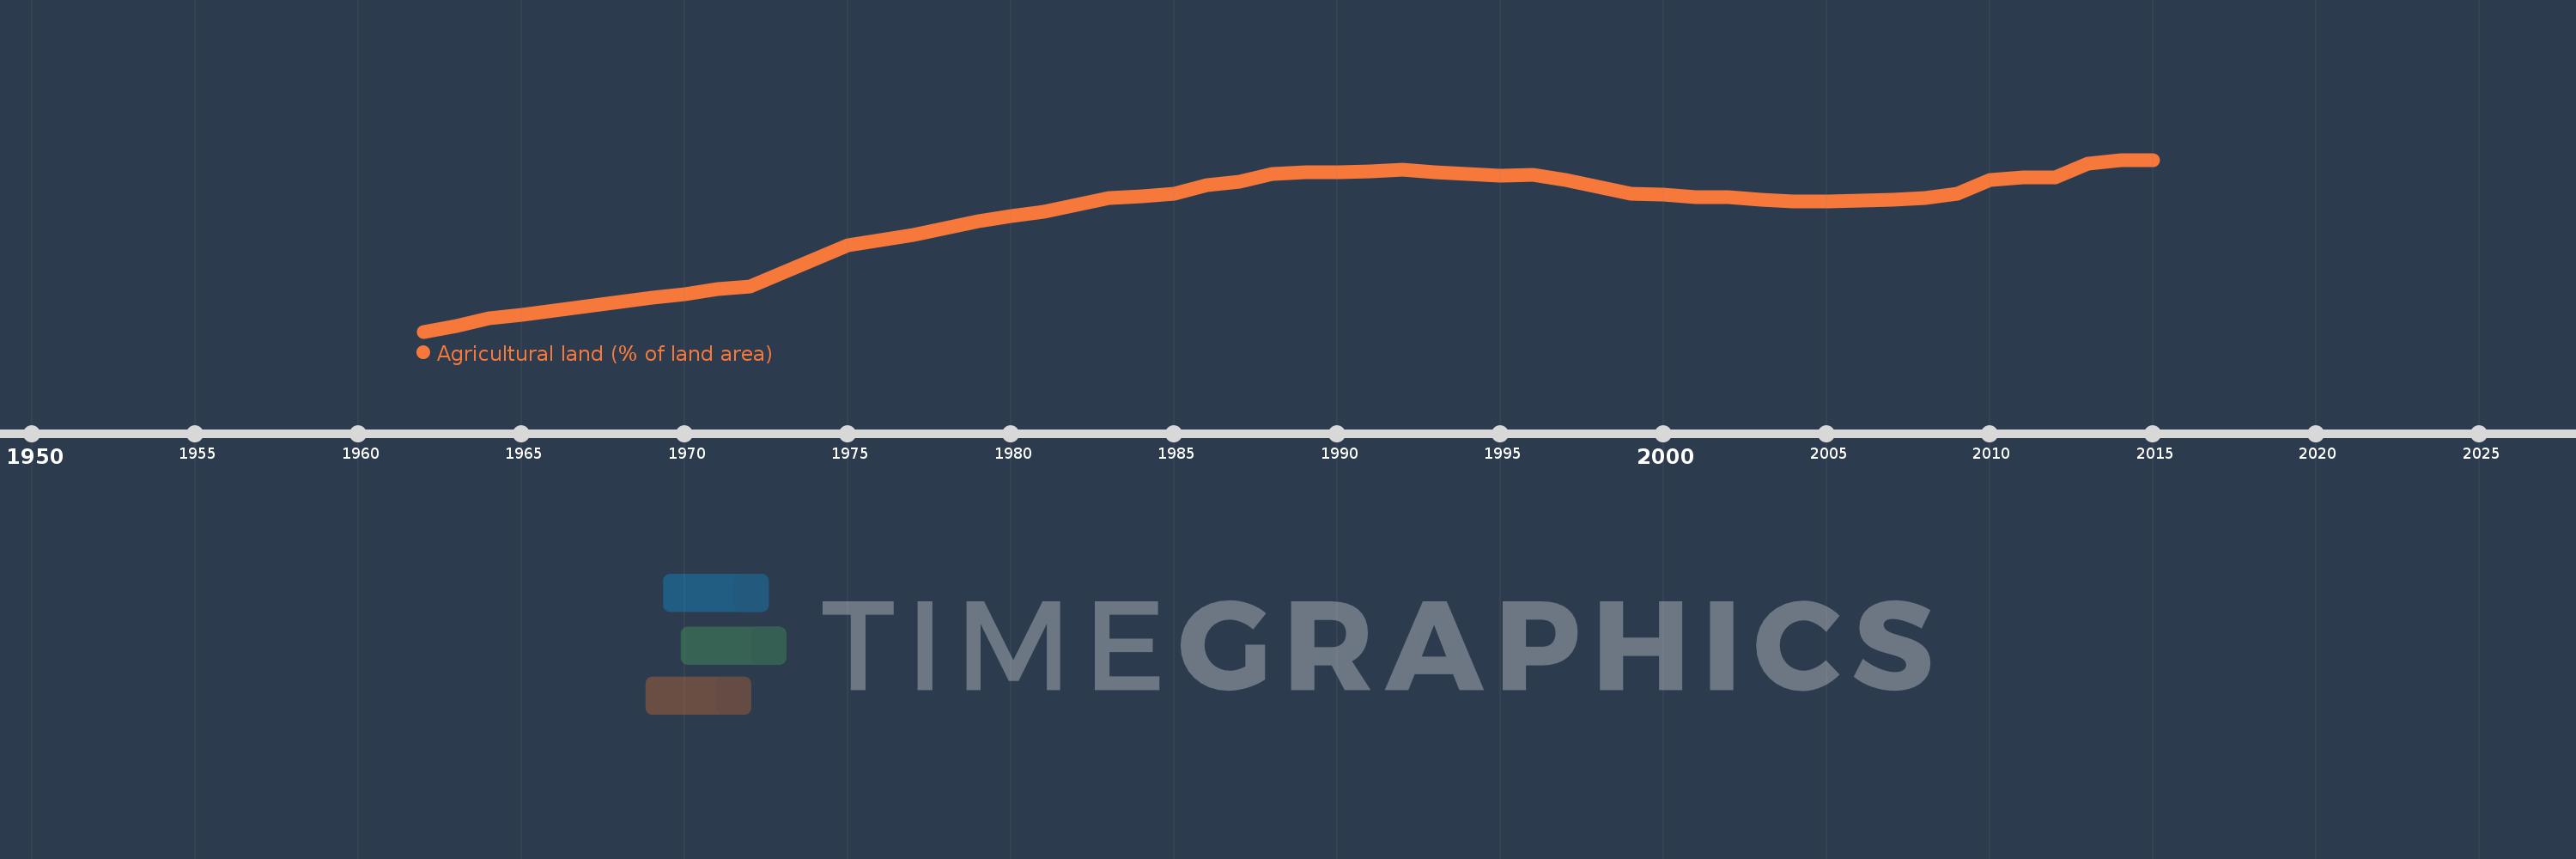
Agricultural land (% of land area)
2015,2014,2013,2012,2011,2010,2009,2008,2007,2006,2005,2004,2003,2002,2001,2000,1999,1998,1997,1996,1995,1994,1993,1992,1991,1990,1989,1988,1987,1986,1985,1984,1983,1982,1981,1980,1979,1978,1977,1976,1975,1974,1973,1972,1971,1970,1969,1968,1967,1966,1965,1964,1963,1962
This statistics in other country:
AfghanistanAlbaniaAlgeriaAmerican SamoaAndorraAngolaAntigua and BarbudaArab WorldArgentinaArmeniaArubaAustraliaAustriaAzerbaijanBahamas, TheBahrainBangladeshBarbadosBelarusBelgiumBelizeBeninBermudaBhutanBoliviaBosnia and HerzegovinaBotswanaBrazilBritish Virgin IslandsBrunei DarussalamBulgariaBurkina FasoBurundiCabo VerdeCambodiaCameroonCanadaCaribbean small statesCayman IslandsCentral African RepublicCentral Europe and the BalticsChadChannel IslandsChileChinaColombiaComorosCongo, Dem. Rep.Congo, Rep.Costa RicaCote d'IvoireCroatiaCubaCyprusCzech RepublicDenmarkDjiboutiDominicaDominican RepublicEarly-demographic dividendEast Asia & PacificEast Asia & Pacific (excluding high income)East Asia & Pacific (IDA & IBRD countries)EcuadorEgypt, Arab Rep.El SalvadorEquatorial GuineaEritreaEstoniaEthiopiaEuro areaEurope & Central AsiaEurope & Central Asia (excluding high income)Europe & Central Asia (IDA & IBRD countries)European UnionFaroe IslandsFijiFinlandFragile and conflict affected situationsFranceFrench PolynesiaGabonGambia, TheGeorgiaGermanyGhanaGreeceGreenlandGrenadaGuamGuatemalaGuineaGuinea-BissauGuyanaHaitiHeavily indebted poor countries (HIPC)High incomeHondurasHong Kong SAR, ChinaHungaryIBRD onlyIcelandIDA & IBRD totalIDA blendIDA onlyIDA totalIndiaIndonesiaIran, Islamic Rep.IraqIrelandIsle of ManIsraelItalyJamaicaJapanJordanKazakhstanKenyaKiribatiKorea, Dem. People’s Rep.Korea, Rep.KosovoKuwaitKyrgyz RepublicLao PDRLate-demographic dividendLatin America & Caribbean Latin America & Caribbean (excluding high income)Latin America & the Caribbean (IDA & IBRD countries)LatviaLeast developed countries: UN classificationLebanonLesothoLiberiaLibyaLiechtensteinLithuaniaLow & middle incomeLow incomeLower middle incomeLuxembourgMacedonia, FYRMadagascarMalawiMalaysiaMaldivesMaliMaltaMarshall IslandsMauritaniaMauritiusMexicoMicronesia, Fed. Sts.Middle East & North AfricaMiddle East & North Africa (excluding high income)Middle East & North Africa (IDA & IBRD countries)Middle incomeMoldovaMongoliaMontenegroMoroccoMozambiqueMyanmarNamibiaNauruNepalNetherlandsNew CaledoniaNew ZealandNicaraguaNigerNigeriaNorth AmericaNorthern Mariana IslandsNorwayOECD membersOmanOther small statesPacific island small statesPakistanPalauPanamaPapua New GuineaParaguayPeruPhilippinesPolandPortugalPost-demographic dividendPre-demographic dividendPuerto RicoQatarRomaniaRussian FederationRwandaSamoaSan MarinoSao Tome and PrincipeSaudi ArabiaSenegalSerbiaSeychellesSierra LeoneSingaporeSlovak RepublicSloveniaSmall statesSolomon IslandsSomaliaSouth AfricaSouth AsiaSouth Asia (IDA & IBRD)SpainSri LankaSt. Kitts and NevisSt. LuciaSt. Vincent and the GrenadinesSub-Saharan Africa Sub-Saharan Africa (excluding high income)Sub-Saharan Africa (IDA & IBRD countries)SudanSurinameSwazilandSwedenSwitzerlandSyrian Arab RepublicTajikistanTanzaniaThailandTimor-LesteTogoTongaTrinidad and TobagoTunisiaTurkeyTurkmenistanTurks and Caicos IslandsTuvaluUgandaUkraineUnited Arab EmiratesUnited KingdomUnited StatesUpper middle incomeUruguayUzbekistanVanuatuVenezuela, RBVietnamVirgin Islands (U.S.)West Bank and GazaWorldYemen, Rep.ZambiaZimbabwe Timeline:
This timeline shows a graph from 1962 to 2015 of Thailand. No data until 1961. Number of actual observations by date: 54.
Source name:
World Development Indicators
Source organization:
Food and Agriculture Organization, electronic files and web site.
Categories, topics:
Agriculture & Rural Development, Climate Change, Environment
Last updated:
apr 23, 2017
Indicators value changes by year
Minimum:
22.809
jan 1, 1962
Maximum:
43.277
jan 1, 2014
At the date of observation
Value
Absolute change
Change from previous value
jan 1, 1962
22.809
+22.809
0.0%
jan 1, 1963
23.449
+0.64
2.81%
jan 1, 1964
24.389
+0.94
4.01%
jan 1, 1965
24.839
+0.45
1.85%
jan 1, 1966
25.328
+0.489
1.97%
jan 1, 1967
25.857
+0.528
2.09%
jan 1, 1968
26.346
+0.489
1.89%
jan 1, 1969
26.816
+0.47
1.78%
jan 1, 1970
27.247
+0.431
1.61%
jan 1, 1971
27.889
+0.642
2.36%
jan 1, 1972
28.184
+0.296
1.06%
jan 1, 1973
29.811
+1.627
5.77%
jan 1, 1974
31.474
+1.664
5.58%
jan 1, 1975
33.046
+1.572
4.99%
jan 1, 1976
33.706
+0.66
2.0%
jan 1, 1977
34.348
+0.642
1.9%
jan 1, 1978
35.164
+0.816
2.38%
jan 1, 1979
35.969
+0.804
2.29%
jan 1, 1980
36.607
+0.638
1.77%
jan 1, 1981
37.069
+0.462
1.26%
jan 1, 1982
37.857
+0.789
2.13%
jan 1, 1983
38.715
+0.857
2.26%
jan 1, 1984
38.948
+0.233
0.6%
jan 1, 1985
39.247
+0.299
0.77%
jan 1, 1986
40.277
+1.03
2.62%
jan 1, 1987
40.664
+0.388
0.96%
jan 1, 1988
41.575
+0.91
2.24%
jan 1, 1989
41.751
+0.176
0.42%
jan 1, 1990
41.764
+0.014
0.03%
jan 1, 1991
41.854
+0.09
0.22%
jan 1, 1992
42.115
+0.26
0.62%
jan 1, 1993
41.837
-0.278
-0.66%
jan 1, 1994
41.584
-0.253
-0.6%
jan 1, 1995
41.34
-0.245
-0.59%
jan 1, 1996
41.516
+0.176
0.43%
jan 1, 1997
40.837
-0.679
-1.64%
jan 1, 1998
40.013
-0.824
-2.02%
jan 1, 1999
39.249
-0.763
-1.91%
jan 1, 2000
39.181
-0.069
-0.17%
jan 1, 2001
38.822
-0.358
-0.91%
jan 1, 2002
38.811
-0.012
-0.03%
jan 1, 2003
38.539
-0.272
-0.7%
jan 1, 2004
38.274
-0.264
-0.69%
jan 1, 2005
38.276
+0.002
0.01%
jan 1, 2006
38.384
+0.108
0.28%
jan 1, 2007
38.56
+0.176
0.46%
jan 1, 2008
38.756
+0.196
0.51%
jan 1, 2009
39.245
+0.489
1.26%
jan 1, 2010
40.868
+1.623
4.13%
jan 1, 2011
41.222
+0.354
0.87%
jan 1, 2012
41.222
0.0
0.0%
jan 1, 2013
42.788
+1.566
3.8%
jan 1, 2014
43.277
+0.489
1.14%
jan 1, 2015
43.277
0.0
0.0%
Ranking of countries by current statistics by years


Comments: