29
/
en
AIzaSyAYiBZKx7MnpbEhh9jyipgxe19OcubqV5w
April 1, 2024
220428
Paraguay
PRY
true
2
1
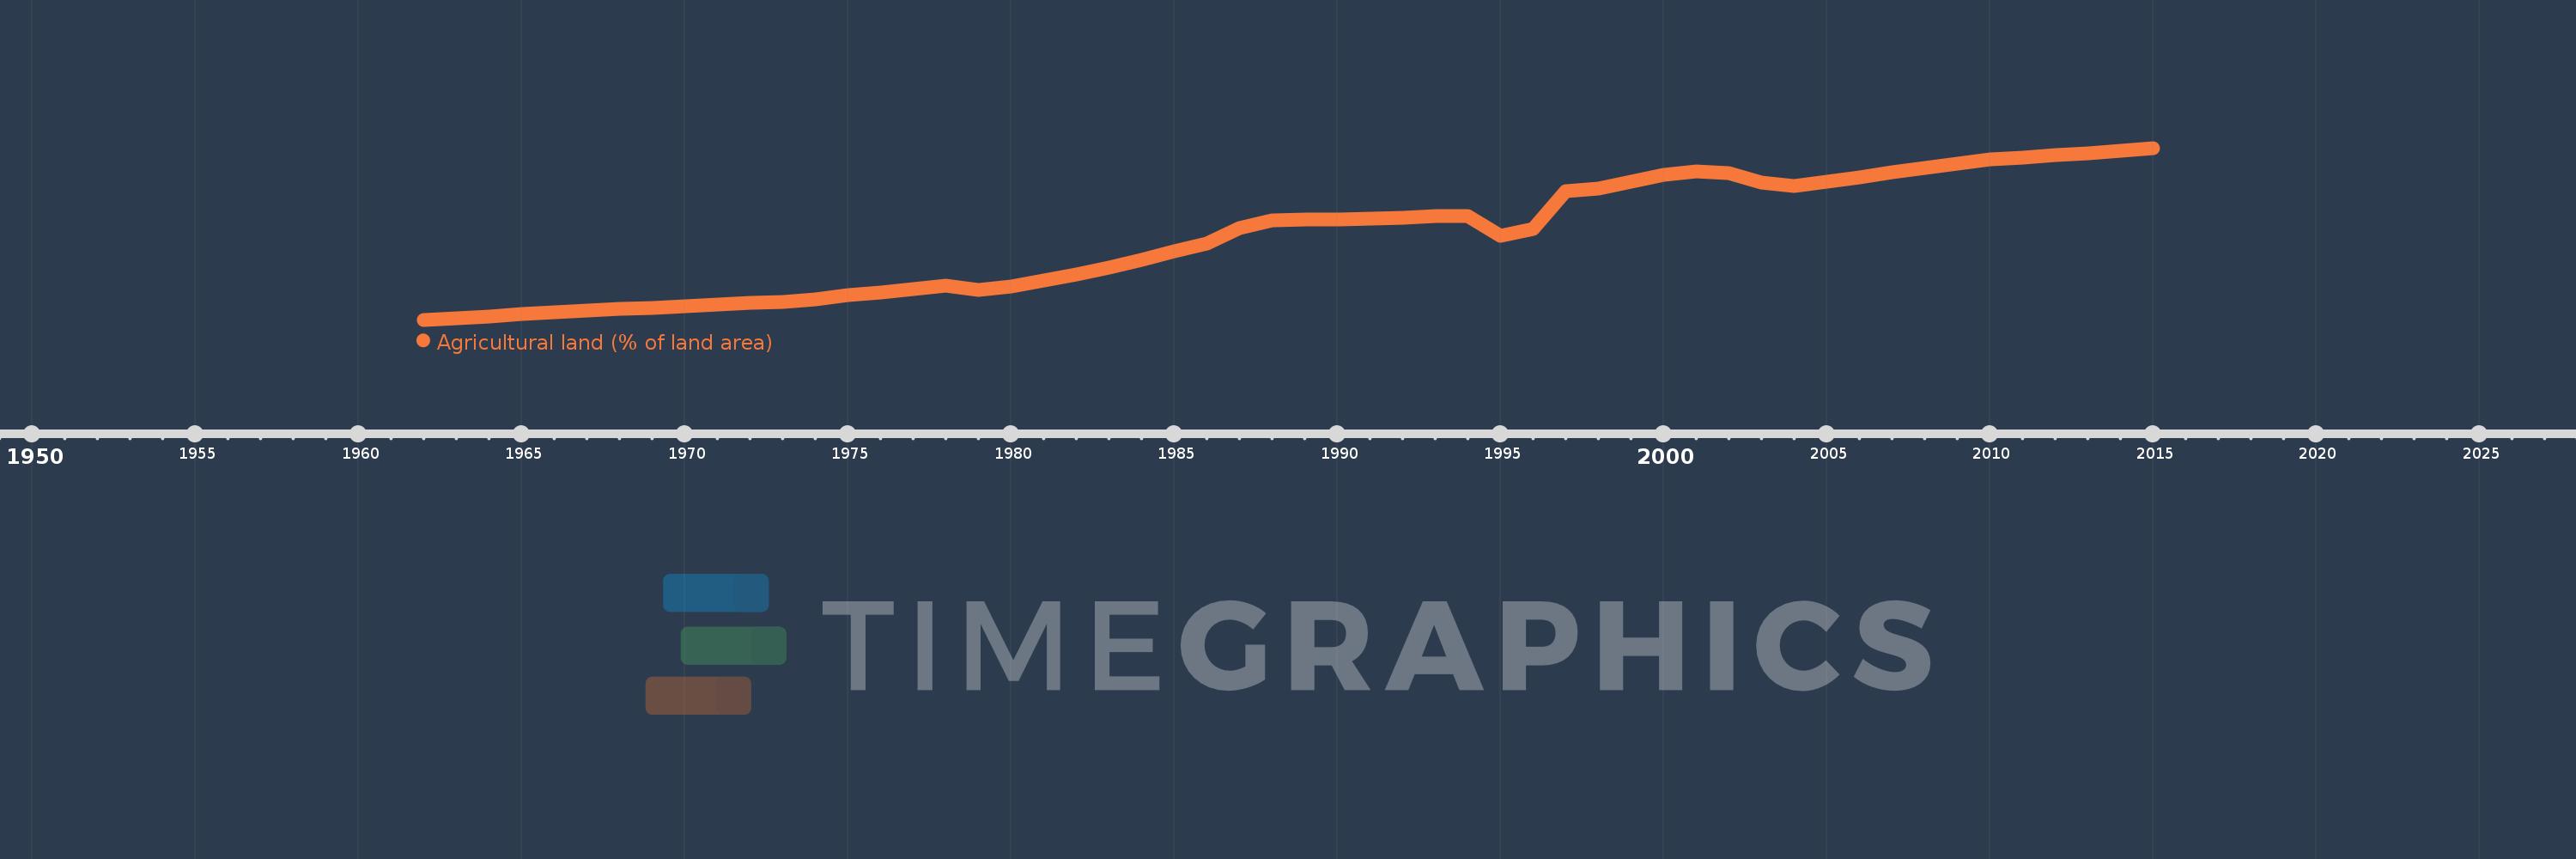
Agricultural land (% of land area)
2015,2014,2013,2012,2011,2010,2009,2008,2007,2006,2005,2004,2003,2002,2001,2000,1999,1998,1997,1996,1995,1994,1993,1992,1991,1990,1989,1988,1987,1986,1985,1984,1983,1982,1981,1980,1979,1978,1977,1976,1975,1974,1973,1972,1971,1970,1969,1968,1967,1966,1965,1964,1963,1962
This statistics in other country:
AfghanistanAlbaniaAlgeriaAmerican SamoaAndorraAngolaAntigua and BarbudaArab WorldArgentinaArmeniaArubaAustraliaAustriaAzerbaijanBahamas, TheBahrainBangladeshBarbadosBelarusBelgiumBelizeBeninBermudaBhutanBoliviaBosnia and HerzegovinaBotswanaBrazilBritish Virgin IslandsBrunei DarussalamBulgariaBurkina FasoBurundiCabo VerdeCambodiaCameroonCanadaCaribbean small statesCayman IslandsCentral African RepublicCentral Europe and the BalticsChadChannel IslandsChileChinaColombiaComorosCongo, Dem. Rep.Congo, Rep.Costa RicaCote d'IvoireCroatiaCubaCyprusCzech RepublicDenmarkDjiboutiDominicaDominican RepublicEarly-demographic dividendEast Asia & PacificEast Asia & Pacific (excluding high income)East Asia & Pacific (IDA & IBRD countries)EcuadorEgypt, Arab Rep.El SalvadorEquatorial GuineaEritreaEstoniaEthiopiaEuro areaEurope & Central AsiaEurope & Central Asia (excluding high income)Europe & Central Asia (IDA & IBRD countries)European UnionFaroe IslandsFijiFinlandFragile and conflict affected situationsFranceFrench PolynesiaGabonGambia, TheGeorgiaGermanyGhanaGreeceGreenlandGrenadaGuamGuatemalaGuineaGuinea-BissauGuyanaHaitiHeavily indebted poor countries (HIPC)High incomeHondurasHong Kong SAR, ChinaHungaryIBRD onlyIcelandIDA & IBRD totalIDA blendIDA onlyIDA totalIndiaIndonesiaIran, Islamic Rep.IraqIrelandIsle of ManIsraelItalyJamaicaJapanJordanKazakhstanKenyaKiribatiKorea, Dem. People’s Rep.Korea, Rep.KosovoKuwaitKyrgyz RepublicLao PDRLate-demographic dividendLatin America & Caribbean Latin America & Caribbean (excluding high income)Latin America & the Caribbean (IDA & IBRD countries)LatviaLeast developed countries: UN classificationLebanonLesothoLiberiaLibyaLiechtensteinLithuaniaLow & middle incomeLow incomeLower middle incomeLuxembourgMacedonia, FYRMadagascarMalawiMalaysiaMaldivesMaliMaltaMarshall IslandsMauritaniaMauritiusMexicoMicronesia, Fed. Sts.Middle East & North AfricaMiddle East & North Africa (excluding high income)Middle East & North Africa (IDA & IBRD countries)Middle incomeMoldovaMongoliaMontenegroMoroccoMozambiqueMyanmarNamibiaNauruNepalNetherlandsNew CaledoniaNew ZealandNicaraguaNigerNigeriaNorth AmericaNorthern Mariana IslandsNorwayOECD membersOmanOther small statesPacific island small statesPakistanPalauPanamaPapua New GuineaParaguayPeruPhilippinesPolandPortugalPost-demographic dividendPre-demographic dividendPuerto RicoQatarRomaniaRussian FederationRwandaSamoaSan MarinoSao Tome and PrincipeSaudi ArabiaSenegalSerbiaSeychellesSierra LeoneSingaporeSlovak RepublicSloveniaSmall statesSolomon IslandsSomaliaSouth AfricaSouth AsiaSouth Asia (IDA & IBRD)SpainSri LankaSt. Kitts and NevisSt. LuciaSt. Vincent and the GrenadinesSub-Saharan Africa Sub-Saharan Africa (excluding high income)Sub-Saharan Africa (IDA & IBRD countries)SudanSurinameSwazilandSwedenSwitzerlandSyrian Arab RepublicTajikistanTanzaniaThailandTimor-LesteTogoTongaTrinidad and TobagoTunisiaTurkeyTurkmenistanTurks and Caicos IslandsTuvaluUgandaUkraineUnited Arab EmiratesUnited KingdomUnited StatesUpper middle incomeUruguayUzbekistanVanuatuVenezuela, RBVietnamVirgin Islands (U.S.)West Bank and GazaWorldYemen, Rep.ZambiaZimbabwe Timeline:
This timeline shows a graph from 1962 to 2015 of Paraguay. No data until 1961. Number of actual observations by date: 54.
Source name:
World Development Indicators
Source organization:
Food and Agriculture Organization, electronic files and web site.
Categories, topics:
Agriculture & Rural Development, Climate Change, Environment
Last updated:
apr 23, 2017
Indicators value changes by year
Minimum:
26.204
jan 1, 1962
Maximum:
55.084
jan 1, 2015
At the date of observation
Value
Absolute change
Change from previous value
jan 1, 1962
26.204
+26.204
0.0%
jan 1, 1963
26.484
+0.279
1.07%
jan 1, 1964
26.781
+0.297
1.12%
jan 1, 1965
27.113
+0.332
1.24%
jan 1, 1966
27.423
+0.31
1.14%
jan 1, 1967
27.737
+0.315
1.15%
jan 1, 1968
27.991
+0.254
0.92%
jan 1, 1969
28.233
+0.242
0.86%
jan 1, 1970
28.485
+0.252
0.89%
jan 1, 1971
28.736
+0.252
0.88%
jan 1, 1972
28.991
+0.254
0.88%
jan 1, 1973
29.242
+0.252
0.87%
jan 1, 1974
29.615
+0.373
1.27%
jan 1, 1975
30.287
+0.672
2.27%
jan 1, 1976
30.843
+0.556
1.84%
jan 1, 1977
31.397
+0.554
1.8%
jan 1, 1978
31.925
+0.529
1.68%
jan 1, 1979
31.223
-0.702
-2.2%
jan 1, 1980
31.752
+0.529
1.69%
jan 1, 1981
32.809
+1.057
3.33%
jan 1, 1982
33.871
+1.062
3.24%
jan 1, 1983
34.969
+1.097
3.24%
jan 1, 1984
36.32
+1.352
3.87%
jan 1, 1985
37.672
+1.352
3.72%
jan 1, 1986
39.011
+1.339
3.55%
jan 1, 1987
41.659
+2.648
6.79%
jan 1, 1988
42.91
+1.251
3.0%
jan 1, 1989
43.003
+0.093
0.22%
jan 1, 1990
43.096
+0.093
0.22%
jan 1, 1991
43.189
+0.093
0.22%
jan 1, 1992
43.28
+0.091
0.21%
jan 1, 1993
43.657
+0.378
0.87%
jan 1, 1994
43.657
0.0
0.0%
jan 1, 1995
40.352
-3.305
-7.57%
jan 1, 1996
41.425
+1.072
2.66%
jan 1, 1997
47.876
+6.451
15.57%
jan 1, 1998
48.253
+0.378
0.79%
jan 1, 1999
49.338
+1.085
2.25%
jan 1, 2000
50.549
+1.211
2.45%
jan 1, 2001
51.158
+0.609
1.2%
jan 1, 2002
50.843
-0.315
-0.62%
jan 1, 2003
49.285
-1.558
-3.06%
jan 1, 2004
48.694
-0.591
-1.2%
jan 1, 2005
49.434
+0.74
1.52%
jan 1, 2006
50.189
+0.755
1.53%
jan 1, 2007
50.931
+0.743
1.48%
jan 1, 2008
51.674
+0.743
1.46%
jan 1, 2009
52.447
+0.773
1.5%
jan 1, 2010
53.108
+0.662
1.26%
jan 1, 2011
53.436
+0.327
0.62%
jan 1, 2012
53.838
+0.403
0.75%
jan 1, 2013
54.115
+0.277
0.51%
jan 1, 2014
54.581
+0.466
0.86%
jan 1, 2015
55.084
+0.503
0.92%
Ranking of countries by current statistics by years


Comments: