29
/
en
AIzaSyAYiBZKx7MnpbEhh9jyipgxe19OcubqV5w
April 1, 2024
252653
Sudan
SDN
true
2
1
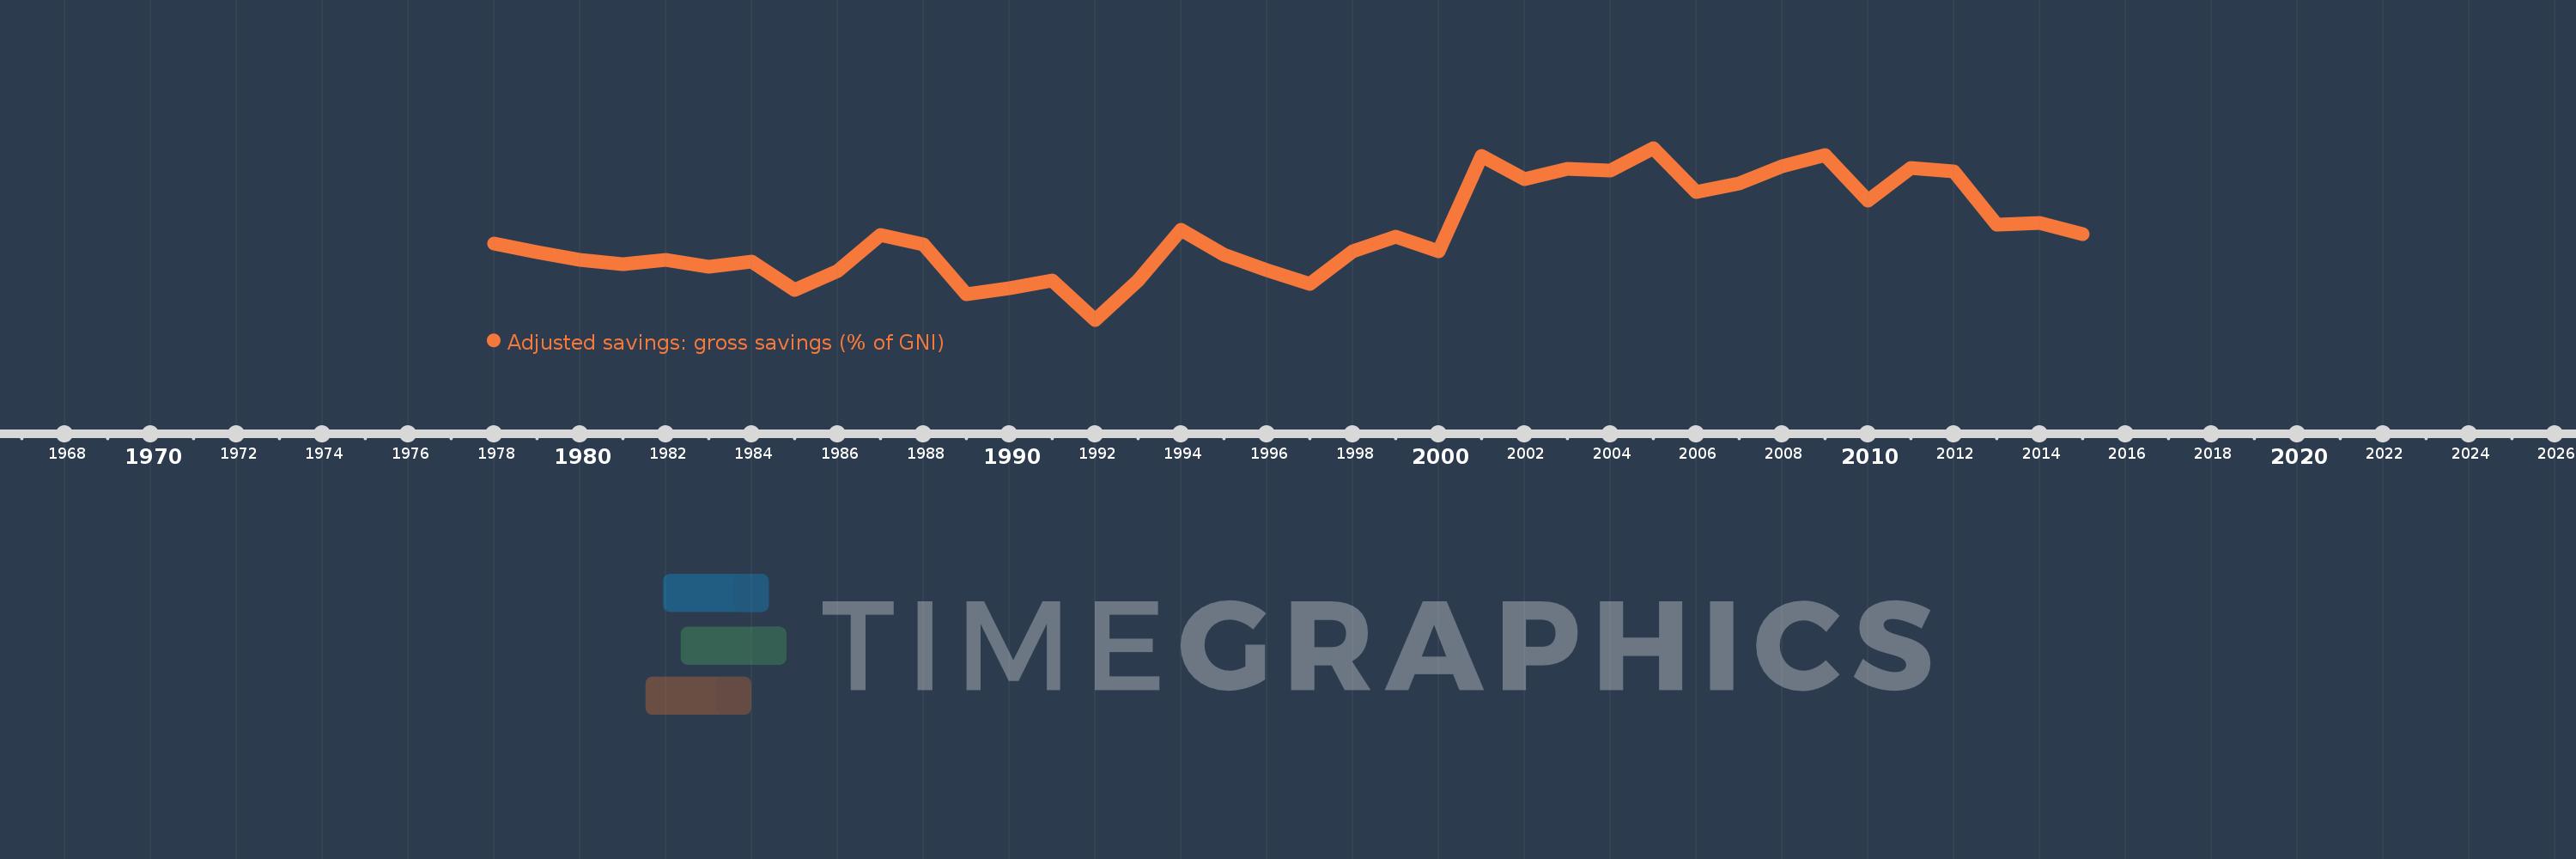
Adjusted savings: gross savings (% of GNI)
2015,2014,2013,2012,2011,2010,2009,2008,2007,2006,2005,2004,2003,2002,2001,2000,1999,1998,1997,1996,1995,1994,1993,1992,1991,1990,1989,1988,1987,1986,1985,1984,1983,1982,1981,1980,1979,1978
This statistics in other country:
AfghanistanAlbaniaAlgeriaAngolaAntigua and BarbudaArab WorldArgentinaArmeniaAustraliaAustriaAzerbaijanBahamas, TheBahrainBangladeshBarbadosBelarusBelgiumBelizeBeninBermudaBhutanBoliviaBosnia and HerzegovinaBotswanaBrazilBrunei DarussalamBulgariaBurkina FasoBurundiCabo VerdeCambodiaCameroonCanadaCaribbean small statesCentral African RepublicCentral Europe and the BalticsChadChileChinaColombiaComorosCongo, Dem. Rep.Congo, Rep.Costa RicaCote d'IvoireCroatiaCyprusCzech RepublicDenmarkDjiboutiDominicaDominican RepublicEarly-demographic dividendEast Asia & PacificEast Asia & Pacific (excluding high income)East Asia & Pacific (IDA & IBRD countries)EcuadorEgypt, Arab Rep.El SalvadorEquatorial GuineaEritreaEstoniaEthiopiaEuro areaEurope & Central AsiaEurope & Central Asia (excluding high income)Europe & Central Asia (IDA & IBRD countries)European UnionFaroe IslandsFijiFinlandFragile and conflict affected situationsFranceGabonGambia, TheGeorgiaGermanyGhanaGreeceGrenadaGuatemalaGuineaGuinea-BissauGuyanaHaitiHeavily indebted poor countries (HIPC)High incomeHondurasHong Kong SAR, ChinaHungaryIBRD onlyIcelandIDA & IBRD totalIDA blendIDA onlyIDA totalIndiaIndonesiaIran, Islamic Rep.IraqIrelandIsraelItalyJamaicaJapanJordanKazakhstanKenyaKiribatiKorea, Rep.KosovoKuwaitKyrgyz RepublicLao PDRLate-demographic dividendLatin America & Caribbean Latin America & Caribbean (excluding high income)Latin America & the Caribbean (IDA & IBRD countries)LatviaLeast developed countries: UN classificationLebanonLesothoLiberiaLibyaLithuaniaLow & middle incomeLow incomeLower middle incomeLuxembourgMacao SAR, ChinaMacedonia, FYRMadagascarMalawiMalaysiaMaldivesMaliMaltaMauritaniaMauritiusMexicoMiddle East & North AfricaMiddle East & North Africa (excluding high income)Middle East & North Africa (IDA & IBRD countries)Middle incomeMoldovaMongoliaMontenegroMoroccoMozambiqueNamibiaNepalNetherlandsNew ZealandNicaraguaNigerNigeriaNorth AmericaNorwayOECD membersOmanOther small statesPacific island small statesPakistanPanamaPapua New GuineaParaguayPeruPhilippinesPolandPortugalPost-demographic dividendPre-demographic dividendQatarRomaniaRussian FederationRwandaSaudi ArabiaSenegalSerbiaSeychellesSierra LeoneSingaporeSlovak RepublicSloveniaSmall statesSolomon IslandsSouth AfricaSouth AsiaSouth Asia (IDA & IBRD)SpainSri LankaSt. Kitts and NevisSt. LuciaSt. Vincent and the GrenadinesSub-Saharan Africa Sub-Saharan Africa (excluding high income)Sub-Saharan Africa (IDA & IBRD countries)SudanSurinameSwazilandSwedenSwitzerlandSyrian Arab RepublicTajikistanTanzaniaThailandTimor-LesteTogoTongaTrinidad and TobagoTunisiaTurkeyTurkmenistanUgandaUkraineUnited KingdomUnited StatesUpper middle incomeUruguayVanuatuVenezuela, RBVietnamWest Bank and GazaWorldYemen, Rep.ZambiaZimbabwe Timeline:
This timeline shows a graph from 1978 to 2015 of Sudan. No data until 1977. Number of actual observations by date: 38.
Source name:
World Development Indicators
Source organization:
World Bank national accounts data files.
Categories, topics:
Economy & Growth, Environment
Last updated:
apr 23, 2017
Indicators value changes by year
Minimum:
-6.084
jan 1, 1992
Maximum:
26.566
jan 1, 2005
At the date of observation
Value
Absolute change
Change from previous value
jan 1, 1978
8.449
+8.449
0.0%
jan 1, 1979
6.831
-1.618
-19.15%
jan 1, 1980
5.235
-1.596
-23.37%
jan 1, 1981
4.524
-0.711
-13.59%
jan 1, 1982
5.346
+0.822
18.17%
jan 1, 1983
3.916
-1.43
-26.75%
jan 1, 1984
4.993
+1.078
27.52%
jan 1, 1985
-0.441
-5.435
-108.84%
jan 1, 1986
3.11
+3.551
-804.71%
jan 1, 1987
10.072
+6.962
223.88%
jan 1, 1988
8.284
-1.788
-17.75%
jan 1, 1989
-1.266
-9.55
-115.28%
jan 1, 1990
-0.131
+1.135
-89.65%
jan 1, 1991
1.339
+1.47
-1.12K%
jan 1, 1992
-6.084
-7.423
-554.43%
jan 1, 1993
1.389
+7.473
-122.84%
jan 1, 1994
11.083
+9.694
697.67%
jan 1, 1995
6.203
-4.88
-44.03%
jan 1, 1996
3.364
-2.839
-45.78%
jan 1, 1997
0.649
-2.715
-80.71%
jan 1, 1998
6.958
+6.309
972.29%
jan 1, 1999
9.775
+2.817
40.48%
jan 1, 2000
6.87
-2.905
-29.72%
jan 1, 2001
25.052
+18.183
264.68%
jan 1, 2002
20.58
-4.473
-17.85%
jan 1, 2003
22.533
+1.954
9.49%
jan 1, 2004
22.28
-0.254
-1.13%
jan 1, 2005
26.566
+4.286
19.24%
jan 1, 2006
18.216
-8.35
-31.43%
jan 1, 2007
19.743
+1.528
8.39%
jan 1, 2008
23.145
+3.402
17.23%
jan 1, 2009
25.147
+2.001
8.65%
jan 1, 2010
16.487
-8.659
-34.44%
jan 1, 2011
22.83
+6.343
38.47%
jan 1, 2012
22.082
-0.748
-3.28%
jan 1, 2013
11.961
-10.121
-45.83%
jan 1, 2014
12.343
+0.382
3.19%
jan 1, 2015
10.155
-2.187
-17.72%
Ranking of countries by current statistics by years


Comments: