29
/
en
AIzaSyAYiBZKx7MnpbEhh9jyipgxe19OcubqV5w
April 1, 2024
50613
Middle income
MIC
false
2
1
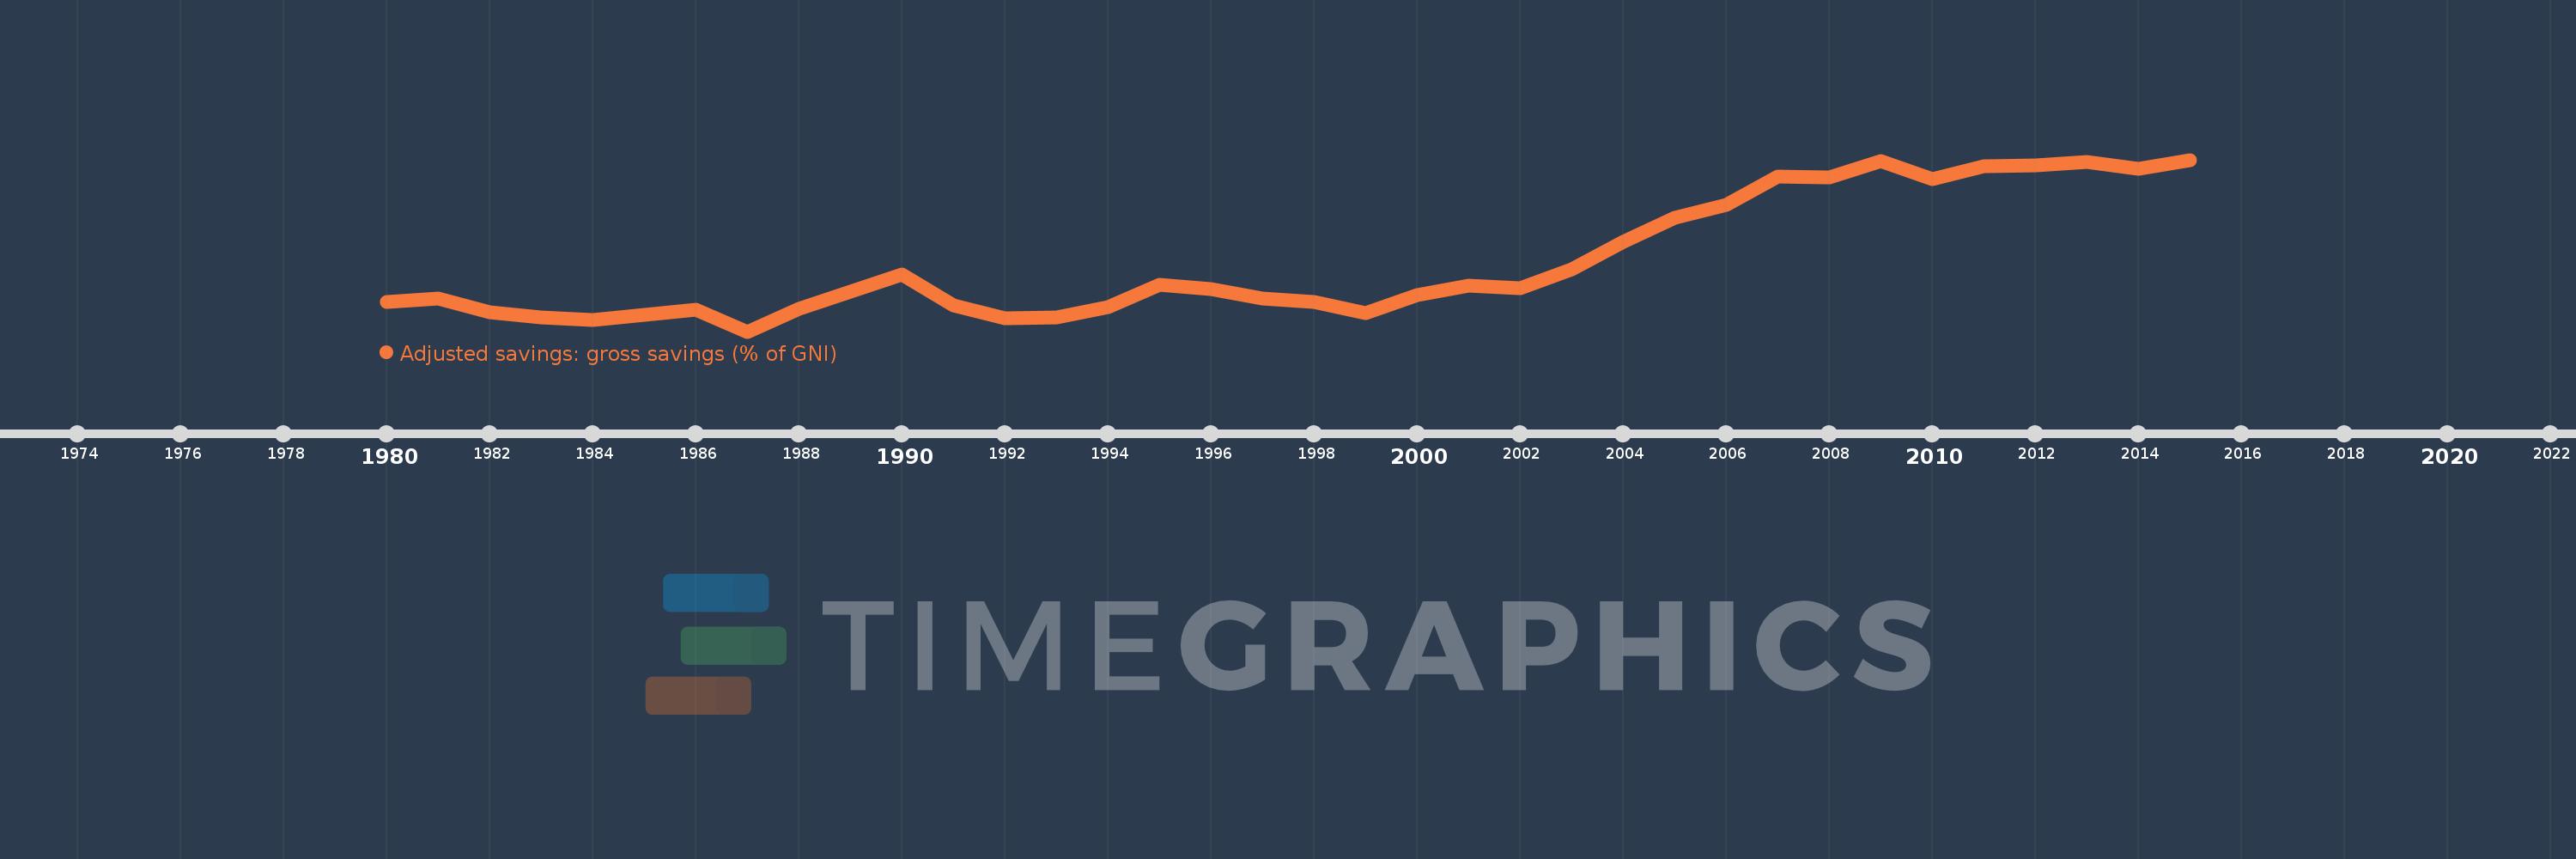
Adjusted savings: gross savings (% of GNI)
2015,2014,2013,2012,2011,2010,2009,2008,2007,2006,2005,2004,2003,2002,2001,2000,1999,1998,1997,1996,1995,1994,1993,1992,1991,1990,1989,1988,1987,1986,1985,1984,1983,1982,1981,1980
This statistics in other country:
AfghanistanAlbaniaAlgeriaAngolaAntigua and BarbudaArab WorldArgentinaArmeniaAustraliaAustriaAzerbaijanBahamas, TheBahrainBangladeshBarbadosBelarusBelgiumBelizeBeninBermudaBhutanBoliviaBosnia and HerzegovinaBotswanaBrazilBrunei DarussalamBulgariaBurkina FasoBurundiCabo VerdeCambodiaCameroonCanadaCaribbean small statesCentral African RepublicCentral Europe and the BalticsChadChileChinaColombiaComorosCongo, Dem. Rep.Congo, Rep.Costa RicaCote d'IvoireCroatiaCyprusCzech RepublicDenmarkDjiboutiDominicaDominican RepublicEarly-demographic dividendEast Asia & PacificEast Asia & Pacific (excluding high income)East Asia & Pacific (IDA & IBRD countries)EcuadorEgypt, Arab Rep.El SalvadorEquatorial GuineaEritreaEstoniaEthiopiaEuro areaEurope & Central AsiaEurope & Central Asia (excluding high income)Europe & Central Asia (IDA & IBRD countries)European UnionFaroe IslandsFijiFinlandFragile and conflict affected situationsFranceGabonGambia, TheGeorgiaGermanyGhanaGreeceGrenadaGuatemalaGuineaGuinea-BissauGuyanaHaitiHeavily indebted poor countries (HIPC)High incomeHondurasHong Kong SAR, ChinaHungaryIBRD onlyIcelandIDA & IBRD totalIDA blendIDA onlyIDA totalIndiaIndonesiaIran, Islamic Rep.IraqIrelandIsraelItalyJamaicaJapanJordanKazakhstanKenyaKiribatiKorea, Rep.KosovoKuwaitKyrgyz RepublicLao PDRLate-demographic dividendLatin America & Caribbean Latin America & Caribbean (excluding high income)Latin America & the Caribbean (IDA & IBRD countries)LatviaLeast developed countries: UN classificationLebanonLesothoLiberiaLibyaLithuaniaLow & middle incomeLow incomeLower middle incomeLuxembourgMacao SAR, ChinaMacedonia, FYRMadagascarMalawiMalaysiaMaldivesMaliMaltaMauritaniaMauritiusMexicoMiddle East & North AfricaMiddle East & North Africa (excluding high income)Middle East & North Africa (IDA & IBRD countries)Middle incomeMoldovaMongoliaMontenegroMoroccoMozambiqueNamibiaNepalNetherlandsNew ZealandNicaraguaNigerNigeriaNorth AmericaNorwayOECD membersOmanOther small statesPacific island small statesPakistanPanamaPapua New GuineaParaguayPeruPhilippinesPolandPortugalPost-demographic dividendPre-demographic dividendQatarRomaniaRussian FederationRwandaSaudi ArabiaSenegalSerbiaSeychellesSierra LeoneSingaporeSlovak RepublicSloveniaSmall statesSolomon IslandsSouth AfricaSouth AsiaSouth Asia (IDA & IBRD)SpainSri LankaSt. Kitts and NevisSt. LuciaSt. Vincent and the GrenadinesSub-Saharan Africa Sub-Saharan Africa (excluding high income)Sub-Saharan Africa (IDA & IBRD countries)SudanSurinameSwazilandSwedenSwitzerlandSyrian Arab RepublicTajikistanTanzaniaThailandTimor-LesteTogoTongaTrinidad and TobagoTunisiaTurkeyTurkmenistanUgandaUkraineUnited KingdomUnited StatesUpper middle incomeUruguayVanuatuVenezuela, RBVietnamWest Bank and GazaWorldYemen, Rep.ZambiaZimbabwe Timeline:
This timeline shows a graph from 1980 to 2015 of Middle income. No data until 1979. Number of actual observations by date: 36.
Source name:
World Development Indicators
Source organization:
World Bank national accounts data files.
Categories, topics:
Economy & Growth, Environment
Last updated:
apr 23, 2017
Indicators value changes by year
Minimum:
22.295
jan 1, 1987
Maximum:
34.061
jan 1, 2015
At the date of observation
Value
Absolute change
Change from previous value
jan 1, 1980
24.351
+24.351
0.0%
jan 1, 1981
24.586
+0.234
0.96%
jan 1, 1982
23.618
-0.968
-3.94%
jan 1, 1983
23.282
-0.336
-1.42%
jan 1, 1984
23.098
-0.183
-0.79%
jan 1, 1985
23.462
+0.364
1.58%
jan 1, 1986
23.798
+0.335
1.43%
jan 1, 1987
22.295
-1.502
-6.31%
jan 1, 1988
23.881
+1.585
7.11%
jan 1, 1989
25.046
+1.165
4.88%
jan 1, 1990
26.205
+1.159
4.63%
jan 1, 1991
24.081
-2.123
-8.1%
jan 1, 1992
23.197
-0.884
-3.67%
jan 1, 1993
23.266
+0.069
0.3%
jan 1, 1994
23.971
+0.705
3.03%
jan 1, 1995
25.49
+1.519
6.34%
jan 1, 1996
25.226
-0.265
-1.04%
jan 1, 1997
24.538
-0.688
-2.73%
jan 1, 1998
24.317
-0.221
-0.9%
jan 1, 1999
23.582
-0.735
-3.02%
jan 1, 2000
24.79
+1.208
5.12%
jan 1, 2001
25.435
+0.645
2.6%
jan 1, 2002
25.294
-0.142
-0.56%
jan 1, 2003
26.54
+1.246
4.93%
jan 1, 2004
28.437
+1.897
7.15%
jan 1, 2005
30.117
+1.68
5.91%
jan 1, 2006
30.989
+0.872
2.89%
jan 1, 2007
32.908
+1.919
6.19%
jan 1, 2008
32.88
-0.028
-0.09%
jan 1, 2009
33.981
+1.101
3.35%
jan 1, 2010
32.74
-1.241
-3.65%
jan 1, 2011
33.603
+0.863
2.64%
jan 1, 2012
33.702
+0.098
0.29%
jan 1, 2013
33.927
+0.225
0.67%
jan 1, 2014
33.422
-0.505
-1.49%
jan 1, 2015
34.061
+0.639
1.91%
Ranking of countries by current statistics by years


Comments: