29
/
en
AIzaSyAYiBZKx7MnpbEhh9jyipgxe19OcubqV5w
April 1, 2024
164431
Jordan
JOR
true
2
1
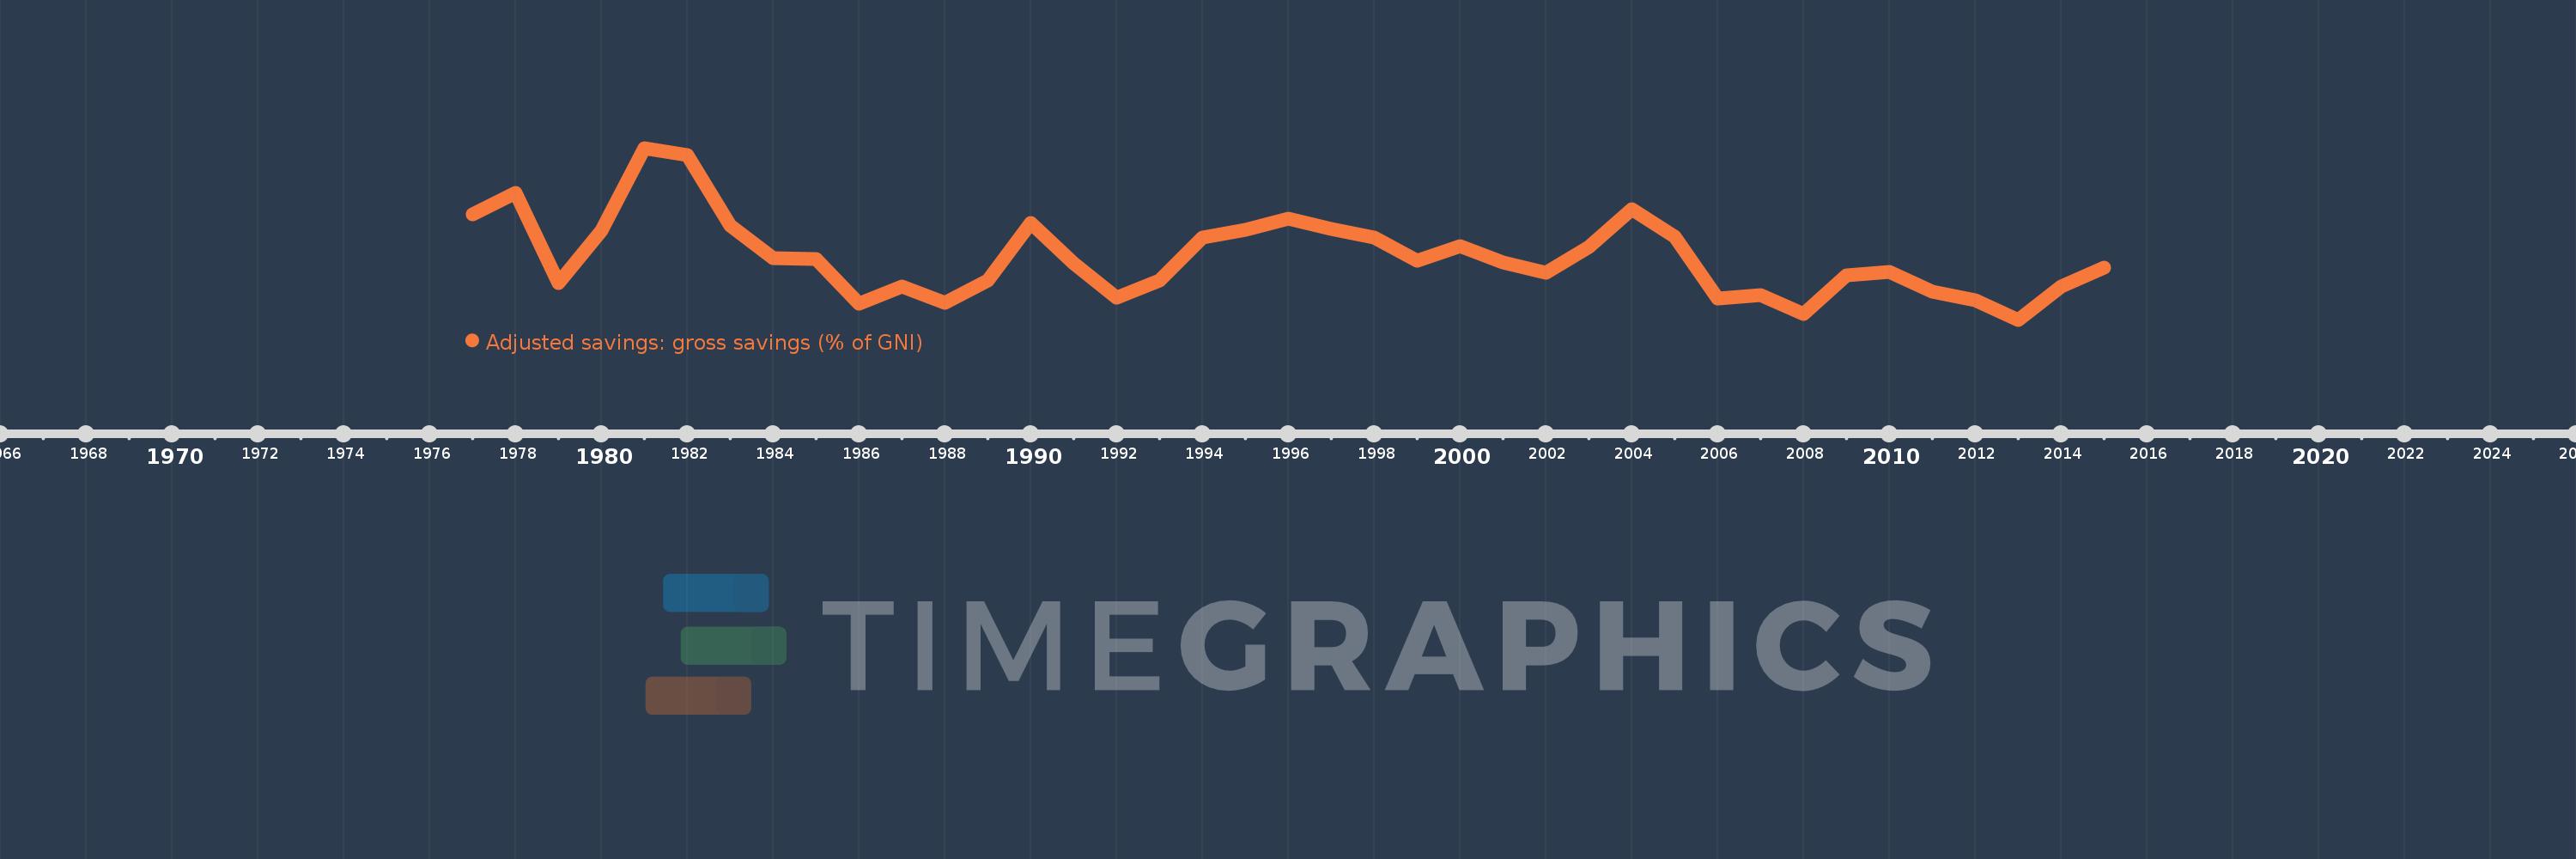
Adjusted savings: gross savings (% of GNI)
2015,2014,2013,2012,2011,2010,2009,2008,2007,2006,2005,2004,2003,2002,2001,2000,1999,1998,1997,1996,1995,1994,1993,1992,1991,1990,1989,1988,1987,1986,1985,1984,1983,1982,1981,1980,1979,1978,1977
This statistics in other country:
AfghanistanAlbaniaAlgeriaAngolaAntigua and BarbudaArab WorldArgentinaArmeniaAustraliaAustriaAzerbaijanBahamas, TheBahrainBangladeshBarbadosBelarusBelgiumBelizeBeninBermudaBhutanBoliviaBosnia and HerzegovinaBotswanaBrazilBrunei DarussalamBulgariaBurkina FasoBurundiCabo VerdeCambodiaCameroonCanadaCaribbean small statesCentral African RepublicCentral Europe and the BalticsChadChileChinaColombiaComorosCongo, Dem. Rep.Congo, Rep.Costa RicaCote d'IvoireCroatiaCyprusCzech RepublicDenmarkDjiboutiDominicaDominican RepublicEarly-demographic dividendEast Asia & PacificEast Asia & Pacific (excluding high income)East Asia & Pacific (IDA & IBRD countries)EcuadorEgypt, Arab Rep.El SalvadorEquatorial GuineaEritreaEstoniaEthiopiaEuro areaEurope & Central AsiaEurope & Central Asia (excluding high income)Europe & Central Asia (IDA & IBRD countries)European UnionFaroe IslandsFijiFinlandFragile and conflict affected situationsFranceGabonGambia, TheGeorgiaGermanyGhanaGreeceGrenadaGuatemalaGuineaGuinea-BissauGuyanaHaitiHeavily indebted poor countries (HIPC)High incomeHondurasHong Kong SAR, ChinaHungaryIBRD onlyIcelandIDA & IBRD totalIDA blendIDA onlyIDA totalIndiaIndonesiaIran, Islamic Rep.IraqIrelandIsraelItalyJamaicaJapanJordanKazakhstanKenyaKiribatiKorea, Rep.KosovoKuwaitKyrgyz RepublicLao PDRLate-demographic dividendLatin America & Caribbean Latin America & Caribbean (excluding high income)Latin America & the Caribbean (IDA & IBRD countries)LatviaLeast developed countries: UN classificationLebanonLesothoLiberiaLibyaLithuaniaLow & middle incomeLow incomeLower middle incomeLuxembourgMacao SAR, ChinaMacedonia, FYRMadagascarMalawiMalaysiaMaldivesMaliMaltaMauritaniaMauritiusMexicoMiddle East & North AfricaMiddle East & North Africa (excluding high income)Middle East & North Africa (IDA & IBRD countries)Middle incomeMoldovaMongoliaMontenegroMoroccoMozambiqueNamibiaNepalNetherlandsNew ZealandNicaraguaNigerNigeriaNorth AmericaNorwayOECD membersOmanOther small statesPacific island small statesPakistanPanamaPapua New GuineaParaguayPeruPhilippinesPolandPortugalPost-demographic dividendPre-demographic dividendQatarRomaniaRussian FederationRwandaSaudi ArabiaSenegalSerbiaSeychellesSierra LeoneSingaporeSlovak RepublicSloveniaSmall statesSolomon IslandsSouth AfricaSouth AsiaSouth Asia (IDA & IBRD)SpainSri LankaSt. Kitts and NevisSt. LuciaSt. Vincent and the GrenadinesSub-Saharan Africa Sub-Saharan Africa (excluding high income)Sub-Saharan Africa (IDA & IBRD countries)SudanSurinameSwazilandSwedenSwitzerlandSyrian Arab RepublicTajikistanTanzaniaThailandTimor-LesteTogoTongaTrinidad and TobagoTunisiaTurkeyTurkmenistanUgandaUkraineUnited KingdomUnited StatesUpper middle incomeUruguayVanuatuVenezuela, RBVietnamWest Bank and GazaWorldYemen, Rep.ZambiaZimbabwe Timeline:
This timeline shows a graph from 1977 to 2015 of Jordan. No data until 1976. Number of actual observations by date: 39.
Source name:
World Development Indicators
Source organization:
World Bank national accounts data files.
Categories, topics:
Economy & Growth, Environment
Last updated:
apr 23, 2017
Indicators value changes by year
Minimum:
11.816
jan 1, 2013
Maximum:
43.391
jan 1, 1981
At the date of observation
Value
Absolute change
Change from previous value
jan 1, 1977
31.156
+31.156
0.0%
jan 1, 1978
35.14
+3.985
12.79%
jan 1, 1979
18.504
-16.636
-47.34%
jan 1, 1980
28.201
+9.697
52.4%
jan 1, 1981
43.391
+15.19
53.86%
jan 1, 1982
42.041
-1.35
-3.11%
jan 1, 1983
29.186
-12.855
-30.58%
jan 1, 1984
23.127
-6.06
-20.76%
jan 1, 1985
23.049
-0.078
-0.34%
jan 1, 1986
14.696
-8.353
-36.24%
jan 1, 1987
17.959
+3.264
22.21%
jan 1, 1988
14.995
-2.964
-16.51%
jan 1, 1989
18.99
+3.995
26.64%
jan 1, 1990
29.562
+10.572
55.67%
jan 1, 1991
22.11
-7.452
-25.21%
jan 1, 1992
15.803
-6.307
-28.53%
jan 1, 1993
18.972
+3.169
20.05%
jan 1, 1994
26.916
+7.945
41.88%
jan 1, 1995
28.34
+1.424
5.29%
jan 1, 1996
30.409
+2.069
7.3%
jan 1, 1997
28.523
-1.886
-6.2%
jan 1, 1998
26.913
-1.61
-5.64%
jan 1, 1999
22.632
-4.281
-15.91%
jan 1, 2000
25.278
+2.646
11.69%
jan 1, 2001
22.399
-2.879
-11.39%
jan 1, 2002
20.392
-2.007
-8.96%
jan 1, 2003
25.115
+4.724
23.16%
jan 1, 2004
32.173
+7.057
28.1%
jan 1, 2005
27.056
-5.117
-15.9%
jan 1, 2006
15.685
-11.371
-42.03%
jan 1, 2007
16.383
+0.698
4.45%
jan 1, 2008
12.951
-3.432
-20.95%
jan 1, 2009
19.919
+6.969
53.81%
jan 1, 2010
20.654
+0.735
3.69%
jan 1, 2011
17.032
-3.622
-17.54%
jan 1, 2012
15.345
-1.687
-9.91%
jan 1, 2013
11.816
-3.529
-23.0%
jan 1, 2014
17.932
+6.116
51.76%
jan 1, 2015
21.413
+3.481
19.41%
Ranking of countries by current statistics by years


Comments: