29
/
en
AIzaSyAYiBZKx7MnpbEhh9jyipgxe19OcubqV5w
April 1, 2024
276342
United States
USA
true
2
1
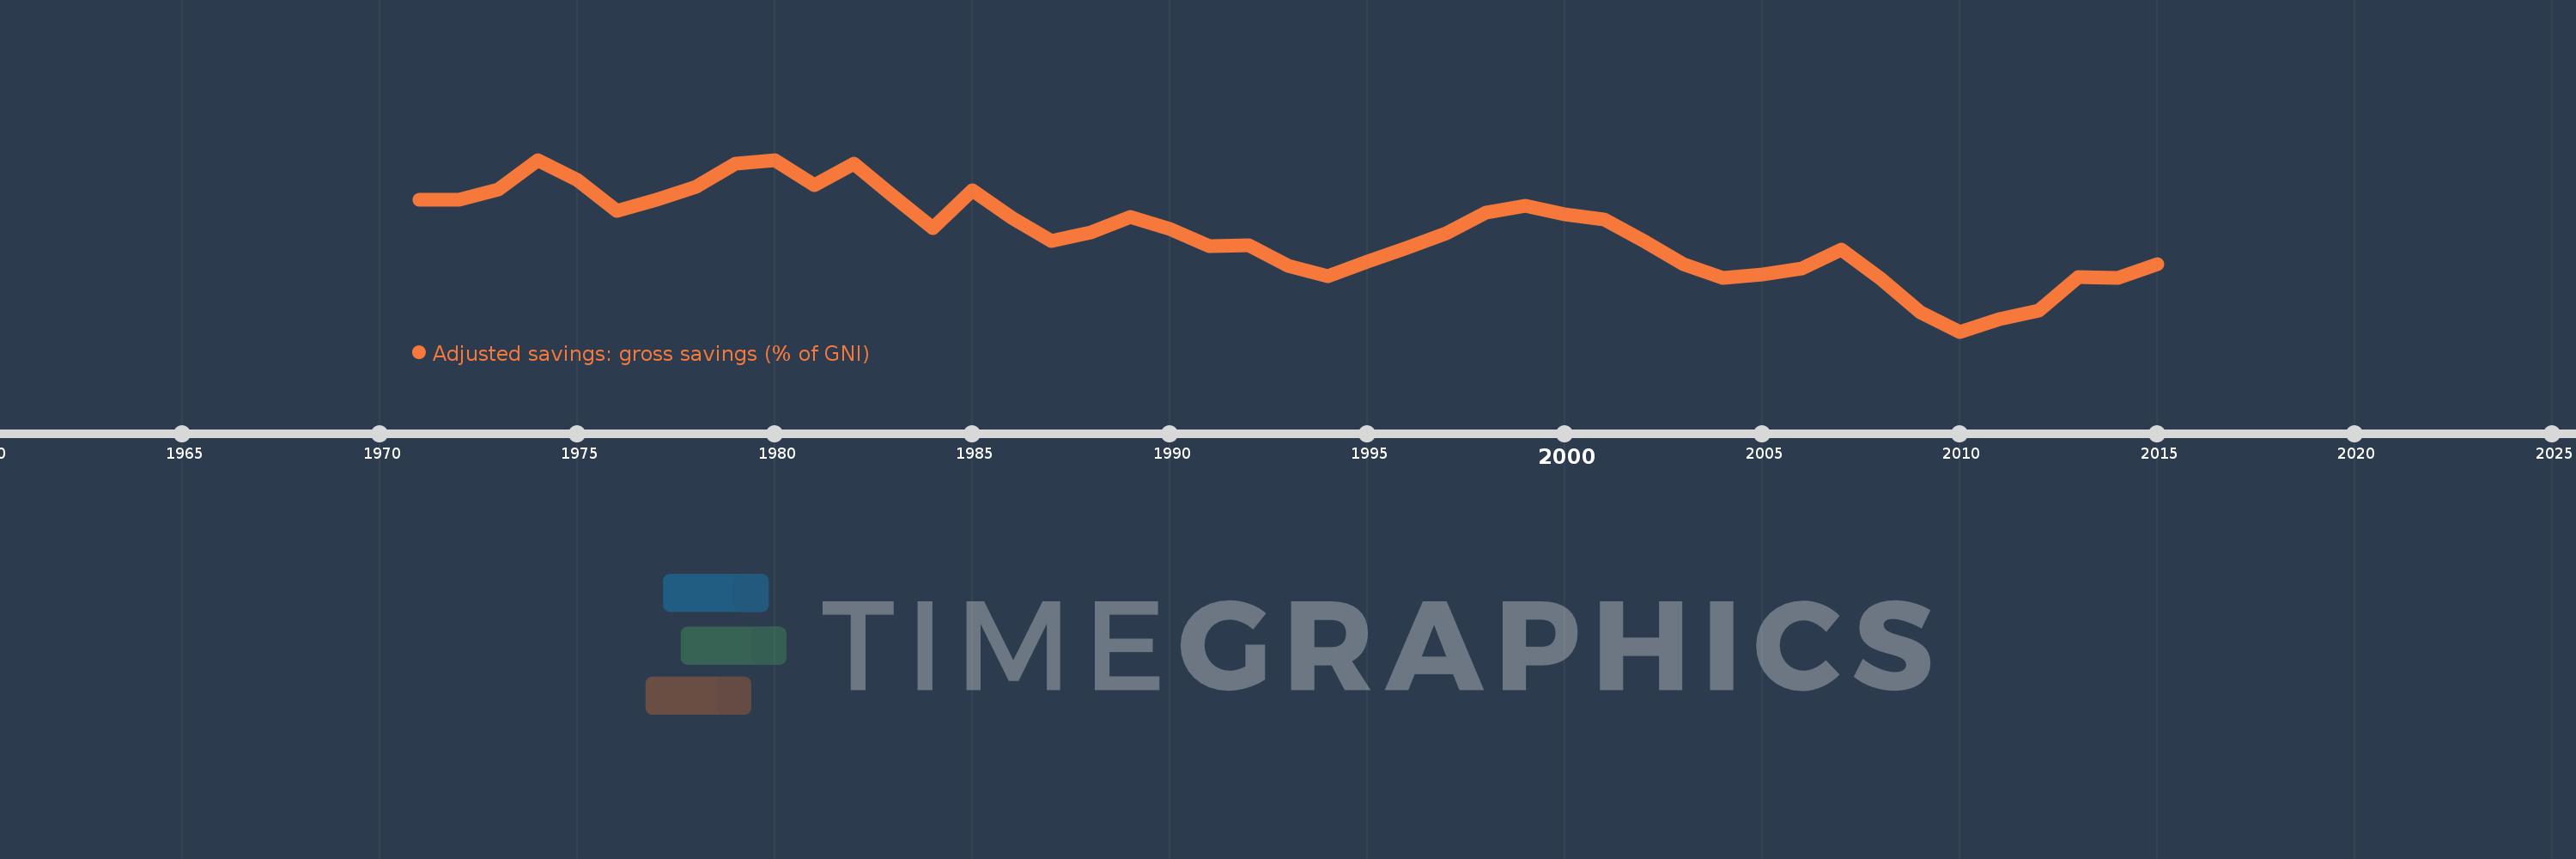
Adjusted savings: gross savings (% of GNI)
2015,2014,2013,2012,2011,2010,2009,2008,2007,2006,2005,2004,2003,2002,2001,2000,1999,1998,1997,1996,1995,1994,1993,1992,1991,1990,1989,1988,1987,1986,1985,1984,1983,1982,1981,1980,1979,1978,1977,1976,1975,1974,1973,1972,1971
This statistics in other country:
AfghanistanAlbaniaAlgeriaAngolaAntigua and BarbudaArab WorldArgentinaArmeniaAustraliaAustriaAzerbaijanBahamas, TheBahrainBangladeshBarbadosBelarusBelgiumBelizeBeninBermudaBhutanBoliviaBosnia and HerzegovinaBotswanaBrazilBrunei DarussalamBulgariaBurkina FasoBurundiCabo VerdeCambodiaCameroonCanadaCaribbean small statesCentral African RepublicCentral Europe and the BalticsChadChileChinaColombiaComorosCongo, Dem. Rep.Congo, Rep.Costa RicaCote d'IvoireCroatiaCyprusCzech RepublicDenmarkDjiboutiDominicaDominican RepublicEarly-demographic dividendEast Asia & PacificEast Asia & Pacific (excluding high income)East Asia & Pacific (IDA & IBRD countries)EcuadorEgypt, Arab Rep.El SalvadorEquatorial GuineaEritreaEstoniaEthiopiaEuro areaEurope & Central AsiaEurope & Central Asia (excluding high income)Europe & Central Asia (IDA & IBRD countries)European UnionFaroe IslandsFijiFinlandFragile and conflict affected situationsFranceGabonGambia, TheGeorgiaGermanyGhanaGreeceGrenadaGuatemalaGuineaGuinea-BissauGuyanaHaitiHeavily indebted poor countries (HIPC)High incomeHondurasHong Kong SAR, ChinaHungaryIBRD onlyIcelandIDA & IBRD totalIDA blendIDA onlyIDA totalIndiaIndonesiaIran, Islamic Rep.IraqIrelandIsraelItalyJamaicaJapanJordanKazakhstanKenyaKiribatiKorea, Rep.KosovoKuwaitKyrgyz RepublicLao PDRLate-demographic dividendLatin America & Caribbean Latin America & Caribbean (excluding high income)Latin America & the Caribbean (IDA & IBRD countries)LatviaLeast developed countries: UN classificationLebanonLesothoLiberiaLibyaLithuaniaLow & middle incomeLow incomeLower middle incomeLuxembourgMacao SAR, ChinaMacedonia, FYRMadagascarMalawiMalaysiaMaldivesMaliMaltaMauritaniaMauritiusMexicoMiddle East & North AfricaMiddle East & North Africa (excluding high income)Middle East & North Africa (IDA & IBRD countries)Middle incomeMoldovaMongoliaMontenegroMoroccoMozambiqueNamibiaNepalNetherlandsNew ZealandNicaraguaNigerNigeriaNorth AmericaNorwayOECD membersOmanOther small statesPacific island small statesPakistanPanamaPapua New GuineaParaguayPeruPhilippinesPolandPortugalPost-demographic dividendPre-demographic dividendQatarRomaniaRussian FederationRwandaSaudi ArabiaSenegalSerbiaSeychellesSierra LeoneSingaporeSlovak RepublicSloveniaSmall statesSolomon IslandsSouth AfricaSouth AsiaSouth Asia (IDA & IBRD)SpainSri LankaSt. Kitts and NevisSt. LuciaSt. Vincent and the GrenadinesSub-Saharan Africa Sub-Saharan Africa (excluding high income)Sub-Saharan Africa (IDA & IBRD countries)SudanSurinameSwazilandSwedenSwitzerlandSyrian Arab RepublicTajikistanTanzaniaThailandTimor-LesteTogoTongaTrinidad and TobagoTunisiaTurkeyTurkmenistanUgandaUkraineUnited KingdomUnited StatesUpper middle incomeUruguayVanuatuVenezuela, RBVietnamWest Bank and GazaWorldYemen, Rep.ZambiaZimbabwe Timeline:
This timeline shows a graph from 1971 to 2015 of United States. No data until 1970. Number of actual observations by date: 45.
Source name:
World Development Indicators
Source organization:
World Bank national accounts data files.
Categories, topics:
Economy & Growth, Environment
Last updated:
apr 23, 2017
Indicators value changes by year
Minimum:
14.361
jan 1, 2010
Maximum:
23.628
jan 1, 1974
At the date of observation
Value
Absolute change
Change from previous value
jan 1, 1971
21.486
+21.486
0.0%
jan 1, 1972
21.462
-0.024
-0.11%
jan 1, 1973
22.029
+0.567
2.64%
jan 1, 1974
23.628
+1.599
7.26%
jan 1, 1975
22.516
-1.112
-4.7%
jan 1, 1976
20.875
-1.642
-7.29%
jan 1, 1977
21.468
+0.594
2.84%
jan 1, 1978
22.162
+0.694
3.23%
jan 1, 1979
23.402
+1.24
5.59%
jan 1, 1980
23.603
+0.201
0.86%
jan 1, 1981
22.25
-1.352
-5.73%
jan 1, 1982
23.397
+1.146
5.15%
jan 1, 1983
21.646
-1.751
-7.48%
jan 1, 1984
19.941
-1.705
-7.88%
jan 1, 1985
21.976
+2.035
10.2%
jan 1, 1986
20.516
-1.459
-6.64%
jan 1, 1987
19.236
-1.281
-6.24%
jan 1, 1988
19.717
+0.481
2.5%
jan 1, 1989
20.543
+0.826
4.19%
jan 1, 1990
19.896
-0.647
-3.15%
jan 1, 1991
18.954
-0.942
-4.73%
jan 1, 1992
19.011
+0.057
0.3%
jan 1, 1993
17.926
-1.085
-5.71%
jan 1, 1994
17.362
-0.564
-3.15%
jan 1, 1995
18.135
+0.773
4.45%
jan 1, 1996
18.883
+0.748
4.13%
jan 1, 1997
19.663
+0.78
4.13%
jan 1, 1998
20.764
+1.101
5.6%
jan 1, 1999
21.153
+0.389
1.87%
jan 1, 2000
20.687
-0.467
-2.21%
jan 1, 2001
20.413
-0.274
-1.32%
jan 1, 2002
19.25
-1.163
-5.7%
jan 1, 2003
18.012
-1.238
-6.43%
jan 1, 2004
17.255
-0.758
-4.21%
jan 1, 2005
17.423
+0.168
0.97%
jan 1, 2006
17.765
+0.342
1.96%
jan 1, 2007
18.801
+1.036
5.83%
jan 1, 2008
17.22
-1.581
-8.41%
jan 1, 2009
15.42
-1.8
-10.45%
jan 1, 2010
14.361
-1.059
-6.86%
jan 1, 2011
15.024
+0.663
4.61%
jan 1, 2012
15.504
+0.48
3.19%
jan 1, 2013
17.283
+1.779
11.48%
jan 1, 2014
17.255
-0.028
-0.16%
jan 1, 2015
18.015
+0.76
4.41%
Ranking of countries by current statistics by years


Comments: