29
/
en
AIzaSyAYiBZKx7MnpbEhh9jyipgxe19OcubqV5w
April 1, 2024
69421
Argentina
ARG
true
2
1
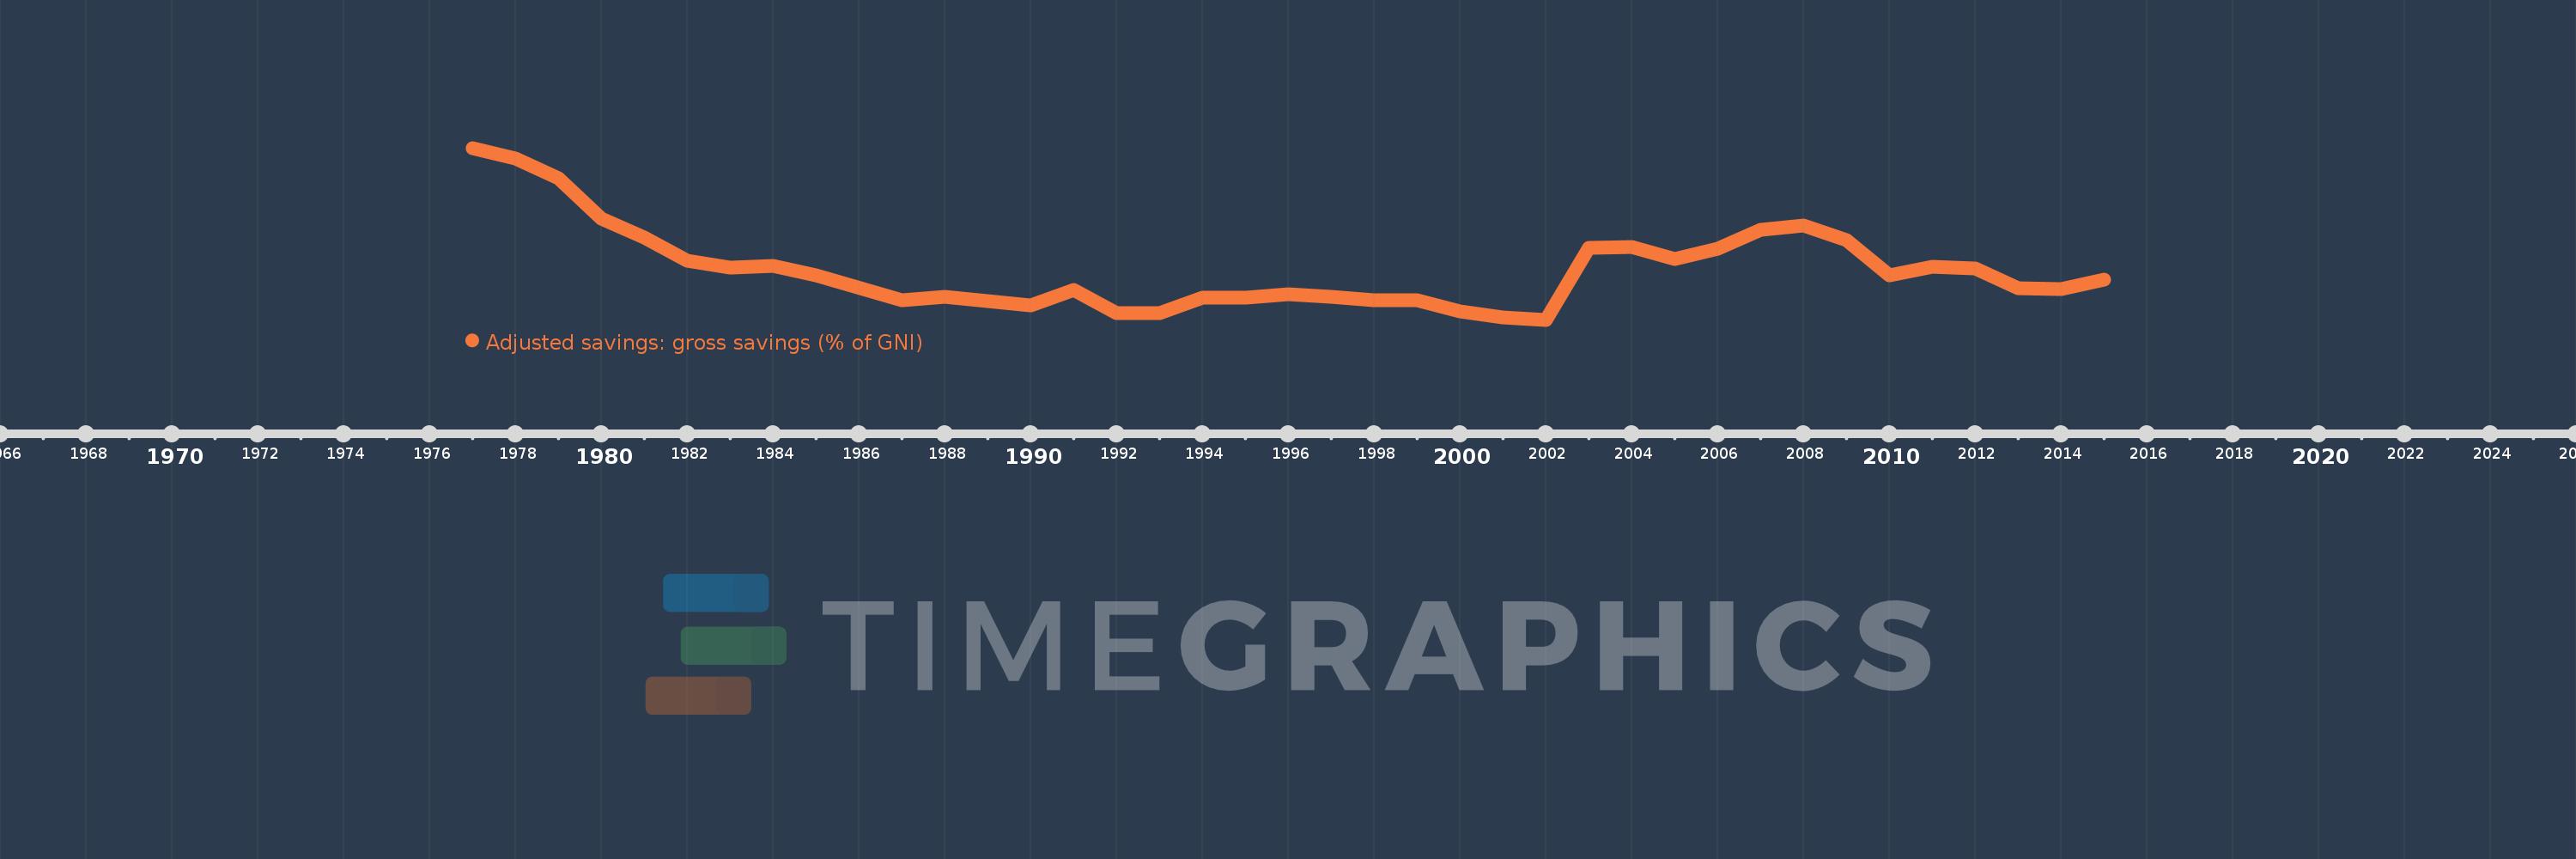
Adjusted savings: gross savings (% of GNI)
2015,2014,2013,2012,2011,2010,2009,2008,2007,2006,2005,2004,2003,2002,2001,2000,1999,1998,1997,1996,1995,1994,1993,1992,1991,1990,1988,1987,1985,1984,1983,1982,1981,1980,1979,1978,1977
This statistics in other country:
AfghanistanAlbaniaAlgeriaAngolaAntigua and BarbudaArab WorldArgentinaArmeniaAustraliaAustriaAzerbaijanBahamas, TheBahrainBangladeshBarbadosBelarusBelgiumBelizeBeninBermudaBhutanBoliviaBosnia and HerzegovinaBotswanaBrazilBrunei DarussalamBulgariaBurkina FasoBurundiCabo VerdeCambodiaCameroonCanadaCaribbean small statesCentral African RepublicCentral Europe and the BalticsChadChileChinaColombiaComorosCongo, Dem. Rep.Congo, Rep.Costa RicaCote d'IvoireCroatiaCyprusCzech RepublicDenmarkDjiboutiDominicaDominican RepublicEarly-demographic dividendEast Asia & PacificEast Asia & Pacific (excluding high income)East Asia & Pacific (IDA & IBRD countries)EcuadorEgypt, Arab Rep.El SalvadorEquatorial GuineaEritreaEstoniaEthiopiaEuro areaEurope & Central AsiaEurope & Central Asia (excluding high income)Europe & Central Asia (IDA & IBRD countries)European UnionFaroe IslandsFijiFinlandFragile and conflict affected situationsFranceGabonGambia, TheGeorgiaGermanyGhanaGreeceGrenadaGuatemalaGuineaGuinea-BissauGuyanaHaitiHeavily indebted poor countries (HIPC)High incomeHondurasHong Kong SAR, ChinaHungaryIBRD onlyIcelandIDA & IBRD totalIDA blendIDA onlyIDA totalIndiaIndonesiaIran, Islamic Rep.IraqIrelandIsraelItalyJamaicaJapanJordanKazakhstanKenyaKiribatiKorea, Rep.KosovoKuwaitKyrgyz RepublicLao PDRLate-demographic dividendLatin America & Caribbean Latin America & Caribbean (excluding high income)Latin America & the Caribbean (IDA & IBRD countries)LatviaLeast developed countries: UN classificationLebanonLesothoLiberiaLibyaLithuaniaLow & middle incomeLow incomeLower middle incomeLuxembourgMacao SAR, ChinaMacedonia, FYRMadagascarMalawiMalaysiaMaldivesMaliMaltaMauritaniaMauritiusMexicoMiddle East & North AfricaMiddle East & North Africa (excluding high income)Middle East & North Africa (IDA & IBRD countries)Middle incomeMoldovaMongoliaMontenegroMoroccoMozambiqueNamibiaNepalNetherlandsNew ZealandNicaraguaNigerNigeriaNorth AmericaNorwayOECD membersOmanOther small statesPacific island small statesPakistanPanamaPapua New GuineaParaguayPeruPhilippinesPolandPortugalPost-demographic dividendPre-demographic dividendQatarRomaniaRussian FederationRwandaSaudi ArabiaSenegalSerbiaSeychellesSierra LeoneSingaporeSlovak RepublicSloveniaSmall statesSolomon IslandsSouth AfricaSouth AsiaSouth Asia (IDA & IBRD)SpainSri LankaSt. Kitts and NevisSt. LuciaSt. Vincent and the GrenadinesSub-Saharan Africa Sub-Saharan Africa (excluding high income)Sub-Saharan Africa (IDA & IBRD countries)SudanSurinameSwazilandSwedenSwitzerlandSyrian Arab RepublicTajikistanTanzaniaThailandTimor-LesteTogoTongaTrinidad and TobagoTunisiaTurkeyTurkmenistanUgandaUkraineUnited KingdomUnited StatesUpper middle incomeUruguayVanuatuVenezuela, RBVietnamWest Bank and GazaWorldYemen, Rep.ZambiaZimbabwe Timeline:
This timeline shows a graph from 1977 to 2015 of Argentina. No data until 1976. Number of actual observations by date: 37.
Source name:
World Development Indicators
Source organization:
World Bank national accounts data files.
Categories, topics:
Economy & Growth, Environment
Last updated:
apr 23, 2017
Indicators value changes by year
Minimum:
13.145
jan 1, 2002
Maximum:
34.038
jan 1, 1977
At the date of observation
Value
Absolute change
Change from previous value
jan 1, 1977
34.038
+34.038
0.0%
jan 1, 1978
32.763
-1.276
-3.75%
jan 1, 1979
30.371
-2.392
-7.3%
jan 1, 1980
25.446
-4.925
-16.22%
jan 1, 1981
23.192
-2.254
-8.86%
jan 1, 1982
20.355
-2.837
-12.23%
jan 1, 1983
19.532
-0.823
-4.04%
jan 1, 1984
19.654
+0.122
0.63%
jan 1, 1985
18.585
-1.07
-5.44%
jan 1, 1987
15.483
-3.102
-16.69%
jan 1, 1988
15.939
+0.456
2.94%
jan 1, 1990
14.876
-1.063
-6.67%
jan 1, 1991
16.78
+1.904
12.8%
jan 1, 1992
13.994
-2.785
-16.6%
jan 1, 1993
13.911
-0.084
-0.6%
jan 1, 1994
15.793
+1.882
13.53%
jan 1, 1995
15.849
+0.057
0.36%
jan 1, 1996
16.243
+0.394
2.48%
jan 1, 1997
15.91
-0.333
-2.05%
jan 1, 1998
15.538
-0.372
-2.34%
jan 1, 1999
15.477
-0.061
-0.39%
jan 1, 2000
14.186
-1.291
-8.34%
jan 1, 2001
13.383
-0.803
-5.66%
jan 1, 2002
13.145
-0.238
-1.78%
jan 1, 2003
21.888
+8.742
66.5%
jan 1, 2004
21.958
+0.07
0.32%
jan 1, 2005
20.552
-1.406
-6.4%
jan 1, 2006
21.742
+1.19
5.79%
jan 1, 2007
24.091
+2.349
10.8%
jan 1, 2008
24.651
+0.561
2.33%
jan 1, 2009
22.824
-1.827
-7.41%
jan 1, 2010
18.59
-4.234
-18.55%
jan 1, 2011
19.572
+0.982
5.28%
jan 1, 2012
19.408
-0.164
-0.84%
jan 1, 2013
16.95
-2.458
-12.67%
jan 1, 2014
16.871
-0.079
-0.46%
jan 1, 2015
18.049
+1.179
6.99%
Ranking of countries by current statistics by years


Comments: