29
/
en
AIzaSyAYiBZKx7MnpbEhh9jyipgxe19OcubqV5w
April 1, 2024
33200
European Union
EUU
false
2
1
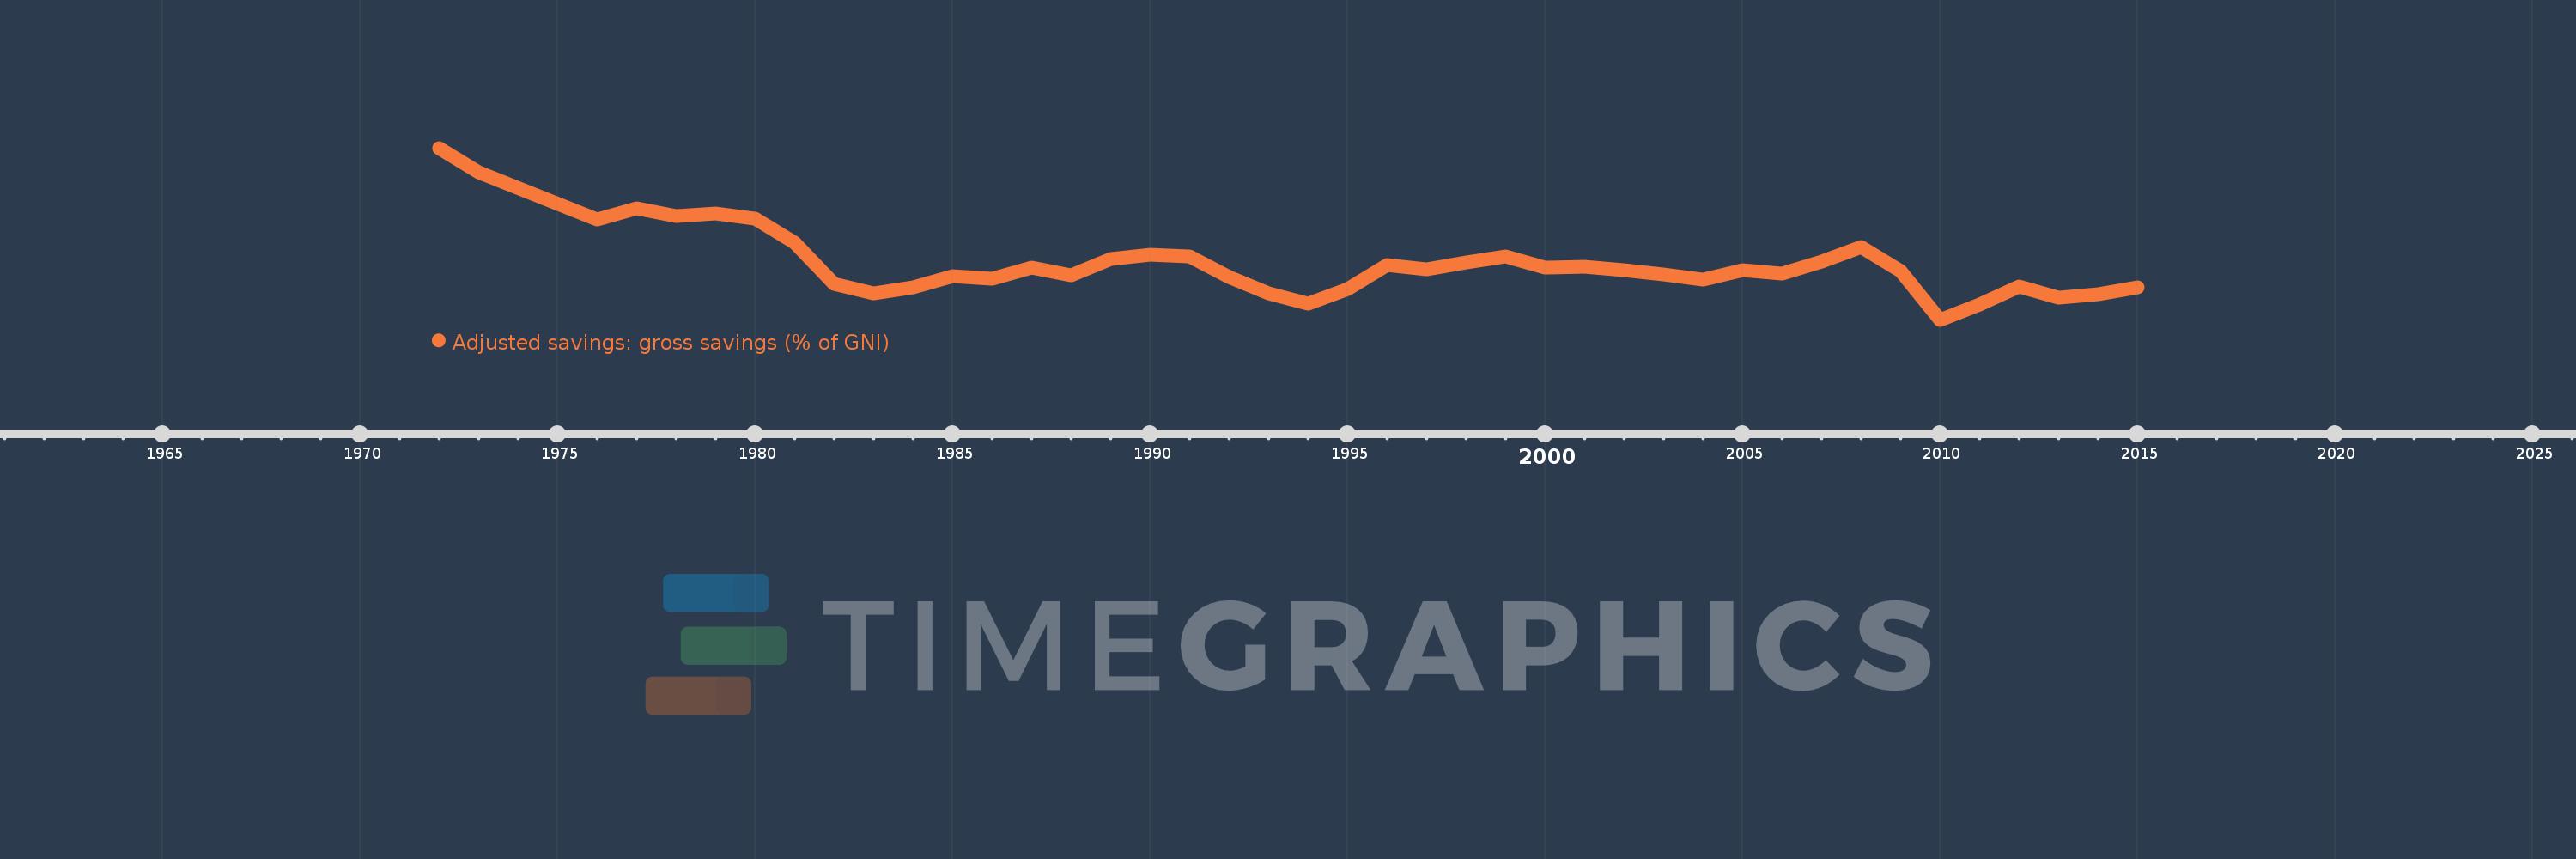
Adjusted savings: gross savings (% of GNI)
2015,2014,2013,2012,2011,2010,2009,2008,2007,2006,2005,2004,2003,2002,2001,2000,1999,1998,1997,1996,1995,1994,1993,1992,1991,1990,1989,1988,1987,1986,1985,1984,1983,1982,1981,1980,1979,1978,1977,1976,1973,1972
This statistics in other country:
AfghanistanAlbaniaAlgeriaAngolaAntigua and BarbudaArab WorldArgentinaArmeniaAustraliaAustriaAzerbaijanBahamas, TheBahrainBangladeshBarbadosBelarusBelgiumBelizeBeninBermudaBhutanBoliviaBosnia and HerzegovinaBotswanaBrazilBrunei DarussalamBulgariaBurkina FasoBurundiCabo VerdeCambodiaCameroonCanadaCaribbean small statesCentral African RepublicCentral Europe and the BalticsChadChileChinaColombiaComorosCongo, Dem. Rep.Congo, Rep.Costa RicaCote d'IvoireCroatiaCyprusCzech RepublicDenmarkDjiboutiDominicaDominican RepublicEarly-demographic dividendEast Asia & PacificEast Asia & Pacific (excluding high income)East Asia & Pacific (IDA & IBRD countries)EcuadorEgypt, Arab Rep.El SalvadorEquatorial GuineaEritreaEstoniaEthiopiaEuro areaEurope & Central AsiaEurope & Central Asia (excluding high income)Europe & Central Asia (IDA & IBRD countries)European UnionFaroe IslandsFijiFinlandFragile and conflict affected situationsFranceGabonGambia, TheGeorgiaGermanyGhanaGreeceGrenadaGuatemalaGuineaGuinea-BissauGuyanaHaitiHeavily indebted poor countries (HIPC)High incomeHondurasHong Kong SAR, ChinaHungaryIBRD onlyIcelandIDA & IBRD totalIDA blendIDA onlyIDA totalIndiaIndonesiaIran, Islamic Rep.IraqIrelandIsraelItalyJamaicaJapanJordanKazakhstanKenyaKiribatiKorea, Rep.KosovoKuwaitKyrgyz RepublicLao PDRLate-demographic dividendLatin America & Caribbean Latin America & Caribbean (excluding high income)Latin America & the Caribbean (IDA & IBRD countries)LatviaLeast developed countries: UN classificationLebanonLesothoLiberiaLibyaLithuaniaLow & middle incomeLow incomeLower middle incomeLuxembourgMacao SAR, ChinaMacedonia, FYRMadagascarMalawiMalaysiaMaldivesMaliMaltaMauritaniaMauritiusMexicoMiddle East & North AfricaMiddle East & North Africa (excluding high income)Middle East & North Africa (IDA & IBRD countries)Middle incomeMoldovaMongoliaMontenegroMoroccoMozambiqueNamibiaNepalNetherlandsNew ZealandNicaraguaNigerNigeriaNorth AmericaNorwayOECD membersOmanOther small statesPacific island small statesPakistanPanamaPapua New GuineaParaguayPeruPhilippinesPolandPortugalPost-demographic dividendPre-demographic dividendQatarRomaniaRussian FederationRwandaSaudi ArabiaSenegalSerbiaSeychellesSierra LeoneSingaporeSlovak RepublicSloveniaSmall statesSolomon IslandsSouth AfricaSouth AsiaSouth Asia (IDA & IBRD)SpainSri LankaSt. Kitts and NevisSt. LuciaSt. Vincent and the GrenadinesSub-Saharan Africa Sub-Saharan Africa (excluding high income)Sub-Saharan Africa (IDA & IBRD countries)SudanSurinameSwazilandSwedenSwitzerlandSyrian Arab RepublicTajikistanTanzaniaThailandTimor-LesteTogoTongaTrinidad and TobagoTunisiaTurkeyTurkmenistanUgandaUkraineUnited KingdomUnited StatesUpper middle incomeUruguayVanuatuVenezuela, RBVietnamWest Bank and GazaWorldYemen, Rep.ZambiaZimbabwe Timeline:
This timeline shows a graph from 1972 to 2015 of European Union. No data until 1971. Number of actual observations by date: 42.
Source name:
World Development Indicators
Source organization:
World Bank national accounts data files.
Categories, topics:
Economy & Growth, Environment
Last updated:
apr 23, 2017
Indicators value changes by year
Minimum:
19.643
jan 1, 2010
At the date of observation
Value
Absolute change
Change from previous value
jan 1, 1972
27.54
+27.54
0.0%
jan 1, 1973
26.416
-1.124
-4.08%
jan 1, 1976
24.243
-2.173
-8.22%
jan 1, 1977
24.781
+0.538
2.22%
jan 1, 1978
24.415
-0.365
-1.47%
jan 1, 1979
24.51
+0.095
0.39%
jan 1, 1980
24.278
-0.232
-0.95%
jan 1, 1981
23.187
-1.091
-4.49%
jan 1, 1982
21.273
-1.914
-8.25%
jan 1, 1983
20.867
-0.406
-1.91%
jan 1, 1984
21.145
+0.278
1.33%
jan 1, 1985
21.627
+0.481
2.28%
jan 1, 1986
21.534
-0.092
-0.43%
jan 1, 1987
22.032
+0.498
2.31%
jan 1, 1988
21.689
-0.343
-1.56%
jan 1, 1989
22.45
+0.762
3.51%
jan 1, 1990
22.617
+0.167
0.74%
jan 1, 1991
22.539
-0.078
-0.35%
jan 1, 1992
21.619
-0.92
-4.08%
jan 1, 1993
20.85
-0.769
-3.56%
jan 1, 1994
20.401
-0.449
-2.16%
jan 1, 1995
21.044
+0.644
3.15%
jan 1, 1996
22.176
+1.132
5.38%
jan 1, 1997
21.98
-0.196
-0.88%
jan 1, 1998
22.285
+0.305
1.39%
jan 1, 1999
22.567
+0.282
1.26%
jan 1, 2000
22.054
-0.513
-2.27%
jan 1, 2001
22.09
+0.036
0.16%
jan 1, 2002
21.938
-0.152
-0.69%
jan 1, 2003
21.726
-0.212
-0.97%
jan 1, 2004
21.474
-0.252
-1.16%
jan 1, 2005
21.913
+0.439
2.04%
jan 1, 2006
21.779
-0.134
-0.61%
jan 1, 2007
22.33
+0.55
2.53%
jan 1, 2008
22.993
+0.663
2.97%
jan 1, 2009
21.9
-1.092
-4.75%
jan 1, 2010
19.643
-2.258
-10.31%
jan 1, 2011
20.343
+0.7
3.57%
jan 1, 2012
21.156
+0.812
3.99%
jan 1, 2013
20.661
-0.495
-2.34%
jan 1, 2014
20.809
+0.148
0.72%
jan 1, 2015
21.144
+0.335
1.61%
Ranking of countries by current statistics by years


Comments: