29
/
en
AIzaSyAYiBZKx7MnpbEhh9jyipgxe19OcubqV5w
April 1, 2024
24645
Caribbean small states
CSS
false
2
1
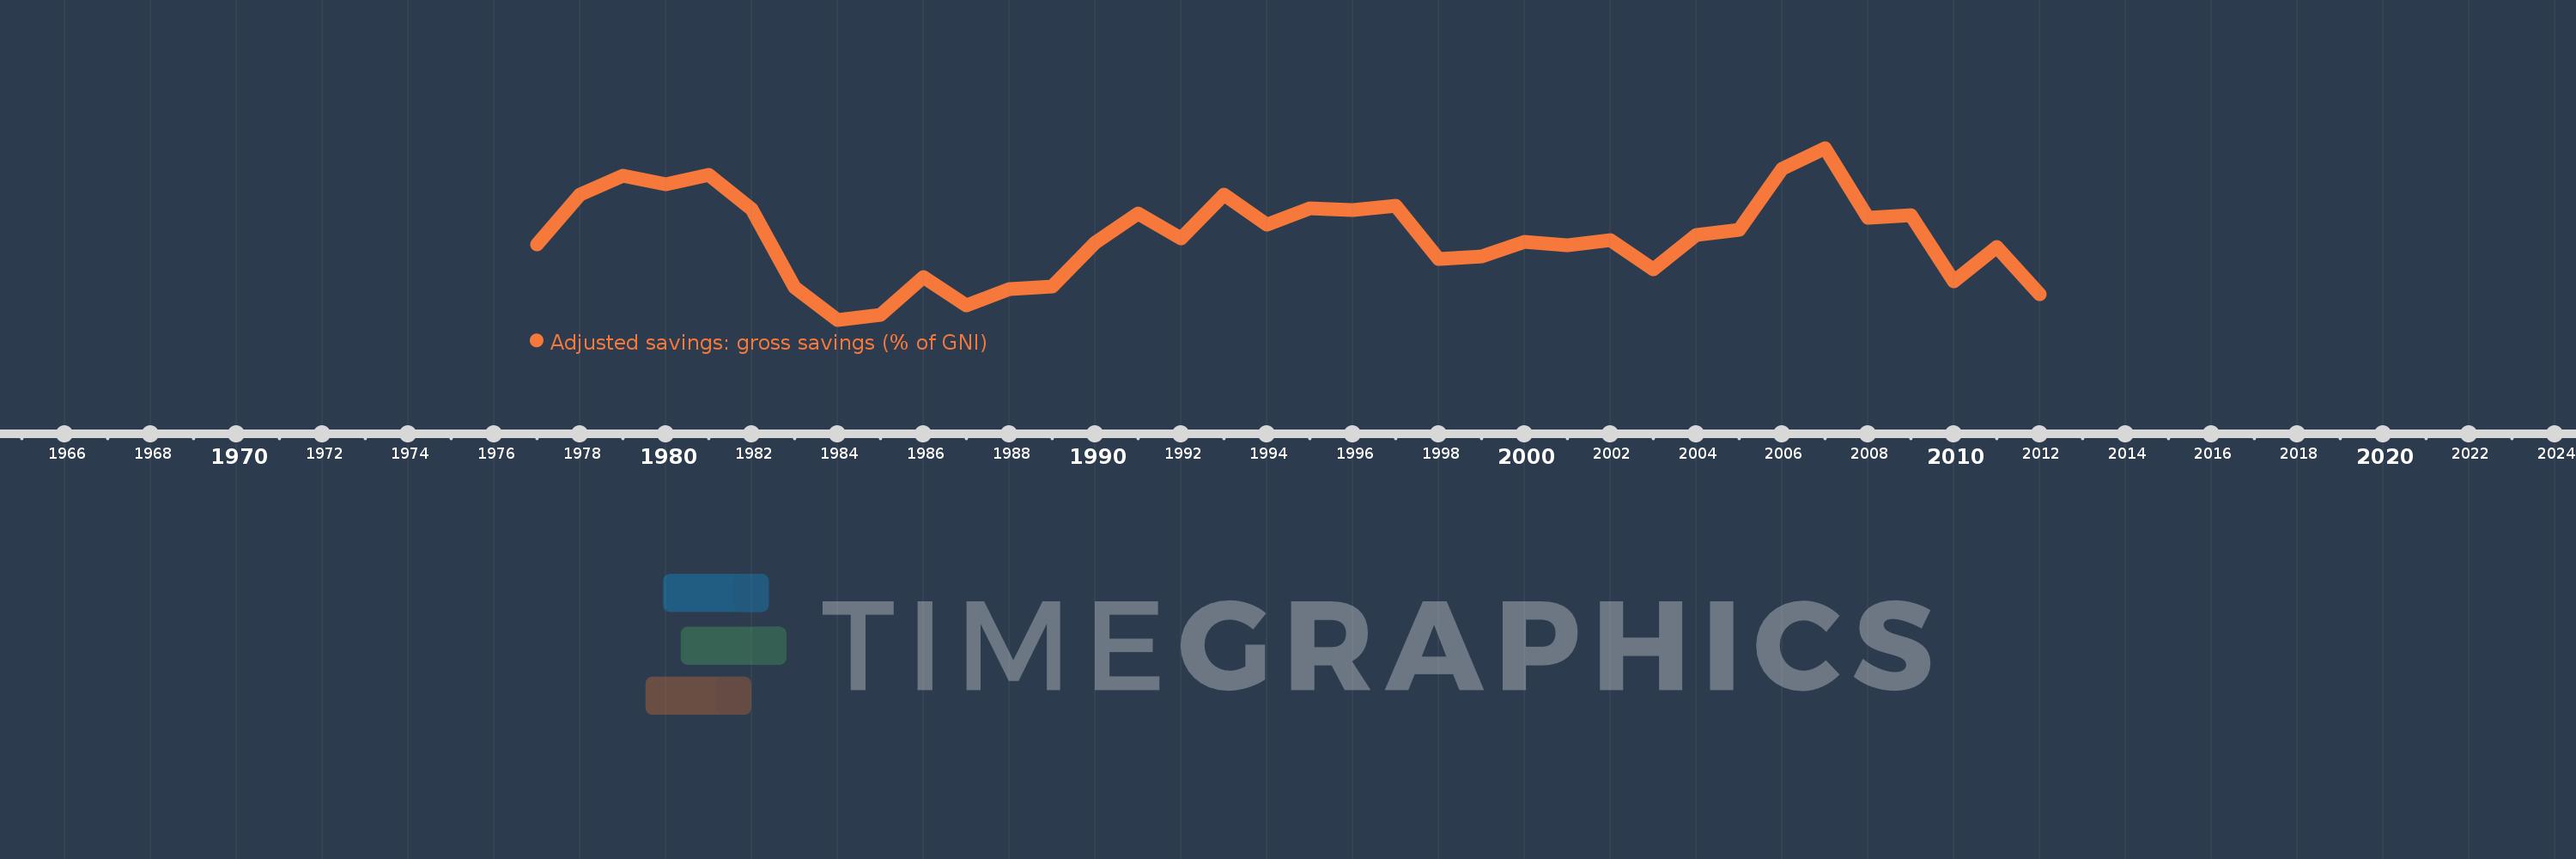
Adjusted savings: gross savings (% of GNI)
2012,2011,2010,2009,2008,2007,2006,2005,2004,2003,2002,2001,2000,1999,1998,1997,1996,1995,1994,1993,1992,1991,1990,1989,1988,1987,1986,1985,1984,1983,1982,1981,1980,1979,1978,1977
This statistics in other country:
AfghanistanAlbaniaAlgeriaAngolaAntigua and BarbudaArab WorldArgentinaArmeniaAustraliaAustriaAzerbaijanBahamas, TheBahrainBangladeshBarbadosBelarusBelgiumBelizeBeninBermudaBhutanBoliviaBosnia and HerzegovinaBotswanaBrazilBrunei DarussalamBulgariaBurkina FasoBurundiCabo VerdeCambodiaCameroonCanadaCaribbean small statesCentral African RepublicCentral Europe and the BalticsChadChileChinaColombiaComorosCongo, Dem. Rep.Congo, Rep.Costa RicaCote d'IvoireCroatiaCyprusCzech RepublicDenmarkDjiboutiDominicaDominican RepublicEarly-demographic dividendEast Asia & PacificEast Asia & Pacific (excluding high income)East Asia & Pacific (IDA & IBRD countries)EcuadorEgypt, Arab Rep.El SalvadorEquatorial GuineaEritreaEstoniaEthiopiaEuro areaEurope & Central AsiaEurope & Central Asia (excluding high income)Europe & Central Asia (IDA & IBRD countries)European UnionFaroe IslandsFijiFinlandFragile and conflict affected situationsFranceGabonGambia, TheGeorgiaGermanyGhanaGreeceGrenadaGuatemalaGuineaGuinea-BissauGuyanaHaitiHeavily indebted poor countries (HIPC)High incomeHondurasHong Kong SAR, ChinaHungaryIBRD onlyIcelandIDA & IBRD totalIDA blendIDA onlyIDA totalIndiaIndonesiaIran, Islamic Rep.IraqIrelandIsraelItalyJamaicaJapanJordanKazakhstanKenyaKiribatiKorea, Rep.KosovoKuwaitKyrgyz RepublicLao PDRLate-demographic dividendLatin America & Caribbean Latin America & Caribbean (excluding high income)Latin America & the Caribbean (IDA & IBRD countries)LatviaLeast developed countries: UN classificationLebanonLesothoLiberiaLibyaLithuaniaLow & middle incomeLow incomeLower middle incomeLuxembourgMacao SAR, ChinaMacedonia, FYRMadagascarMalawiMalaysiaMaldivesMaliMaltaMauritaniaMauritiusMexicoMiddle East & North AfricaMiddle East & North Africa (excluding high income)Middle East & North Africa (IDA & IBRD countries)Middle incomeMoldovaMongoliaMontenegroMoroccoMozambiqueNamibiaNepalNetherlandsNew ZealandNicaraguaNigerNigeriaNorth AmericaNorwayOECD membersOmanOther small statesPacific island small statesPakistanPanamaPapua New GuineaParaguayPeruPhilippinesPolandPortugalPost-demographic dividendPre-demographic dividendQatarRomaniaRussian FederationRwandaSaudi ArabiaSenegalSerbiaSeychellesSierra LeoneSingaporeSlovak RepublicSloveniaSmall statesSolomon IslandsSouth AfricaSouth AsiaSouth Asia (IDA & IBRD)SpainSri LankaSt. Kitts and NevisSt. LuciaSt. Vincent and the GrenadinesSub-Saharan Africa Sub-Saharan Africa (excluding high income)Sub-Saharan Africa (IDA & IBRD countries)SudanSurinameSwazilandSwedenSwitzerlandSyrian Arab RepublicTajikistanTanzaniaThailandTimor-LesteTogoTongaTrinidad and TobagoTunisiaTurkeyTurkmenistanUgandaUkraineUnited KingdomUnited StatesUpper middle incomeUruguayVanuatuVenezuela, RBVietnamWest Bank and GazaWorldYemen, Rep.ZambiaZimbabwe Timeline:
This timeline shows a graph from 1977 to 2012 of Caribbean small states. No data until 1976. Number of actual observations by date: 36.
Source name:
World Development Indicators
Source organization:
World Bank national accounts data files.
Categories, topics:
Economy & Growth, Environment
Last updated:
apr 23, 2017
Indicators value changes by year
Minimum:
13.301
jan 1, 1984
Maximum:
31.298
jan 1, 2007
At the date of observation
Value
Absolute change
Change from previous value
jan 1, 1977
21.201
+21.201
0.0%
jan 1, 1978
26.431
+5.23
24.67%
jan 1, 1979
28.4
+1.97
7.45%
jan 1, 1980
27.485
-0.916
-3.22%
jan 1, 1981
28.467
+0.983
3.58%
jan 1, 1982
24.879
-3.588
-12.61%
jan 1, 1983
16.71
-8.169
-32.84%
jan 1, 1984
13.301
-3.409
-20.4%
jan 1, 1985
13.834
+0.532
4.0%
jan 1, 1986
17.758
+3.924
28.37%
jan 1, 1987
14.779
-2.979
-16.77%
jan 1, 1988
16.481
+1.702
11.52%
jan 1, 1989
16.765
+0.284
1.72%
jan 1, 1990
21.332
+4.567
27.24%
jan 1, 1991
24.39
+3.058
14.34%
jan 1, 1992
21.824
-2.566
-10.52%
jan 1, 1993
26.385
+4.561
20.9%
jan 1, 1994
23.24
-3.145
-11.92%
jan 1, 1995
24.954
+1.714
7.38%
jan 1, 1996
24.83
-0.124
-0.5%
jan 1, 1997
25.216
+0.386
1.55%
jan 1, 1998
19.643
-5.573
-22.1%
jan 1, 1999
19.898
+0.255
1.3%
jan 1, 2000
21.441
+1.543
7.75%
jan 1, 2001
21.082
-0.358
-1.67%
jan 1, 2002
21.601
+0.519
2.46%
jan 1, 2003
18.556
-3.046
-14.1%
jan 1, 2004
22.187
+3.631
19.57%
jan 1, 2005
22.72
+0.533
2.4%
jan 1, 2006
29.077
+6.357
27.98%
jan 1, 2007
31.298
+2.221
7.64%
jan 1, 2008
23.998
-7.3
-23.32%
jan 1, 2009
24.238
+0.24
1.0%
jan 1, 2010
17.356
-6.882
-28.4%
jan 1, 2011
20.906
+3.55
20.46%
jan 1, 2012
15.996
-4.91
-23.49%
Ranking of countries by current statistics by years


Comments: