29
/
en
AIzaSyAYiBZKx7MnpbEhh9jyipgxe19OcubqV5w
April 1, 2024
209949
Nicaragua
NIC
true
2
1
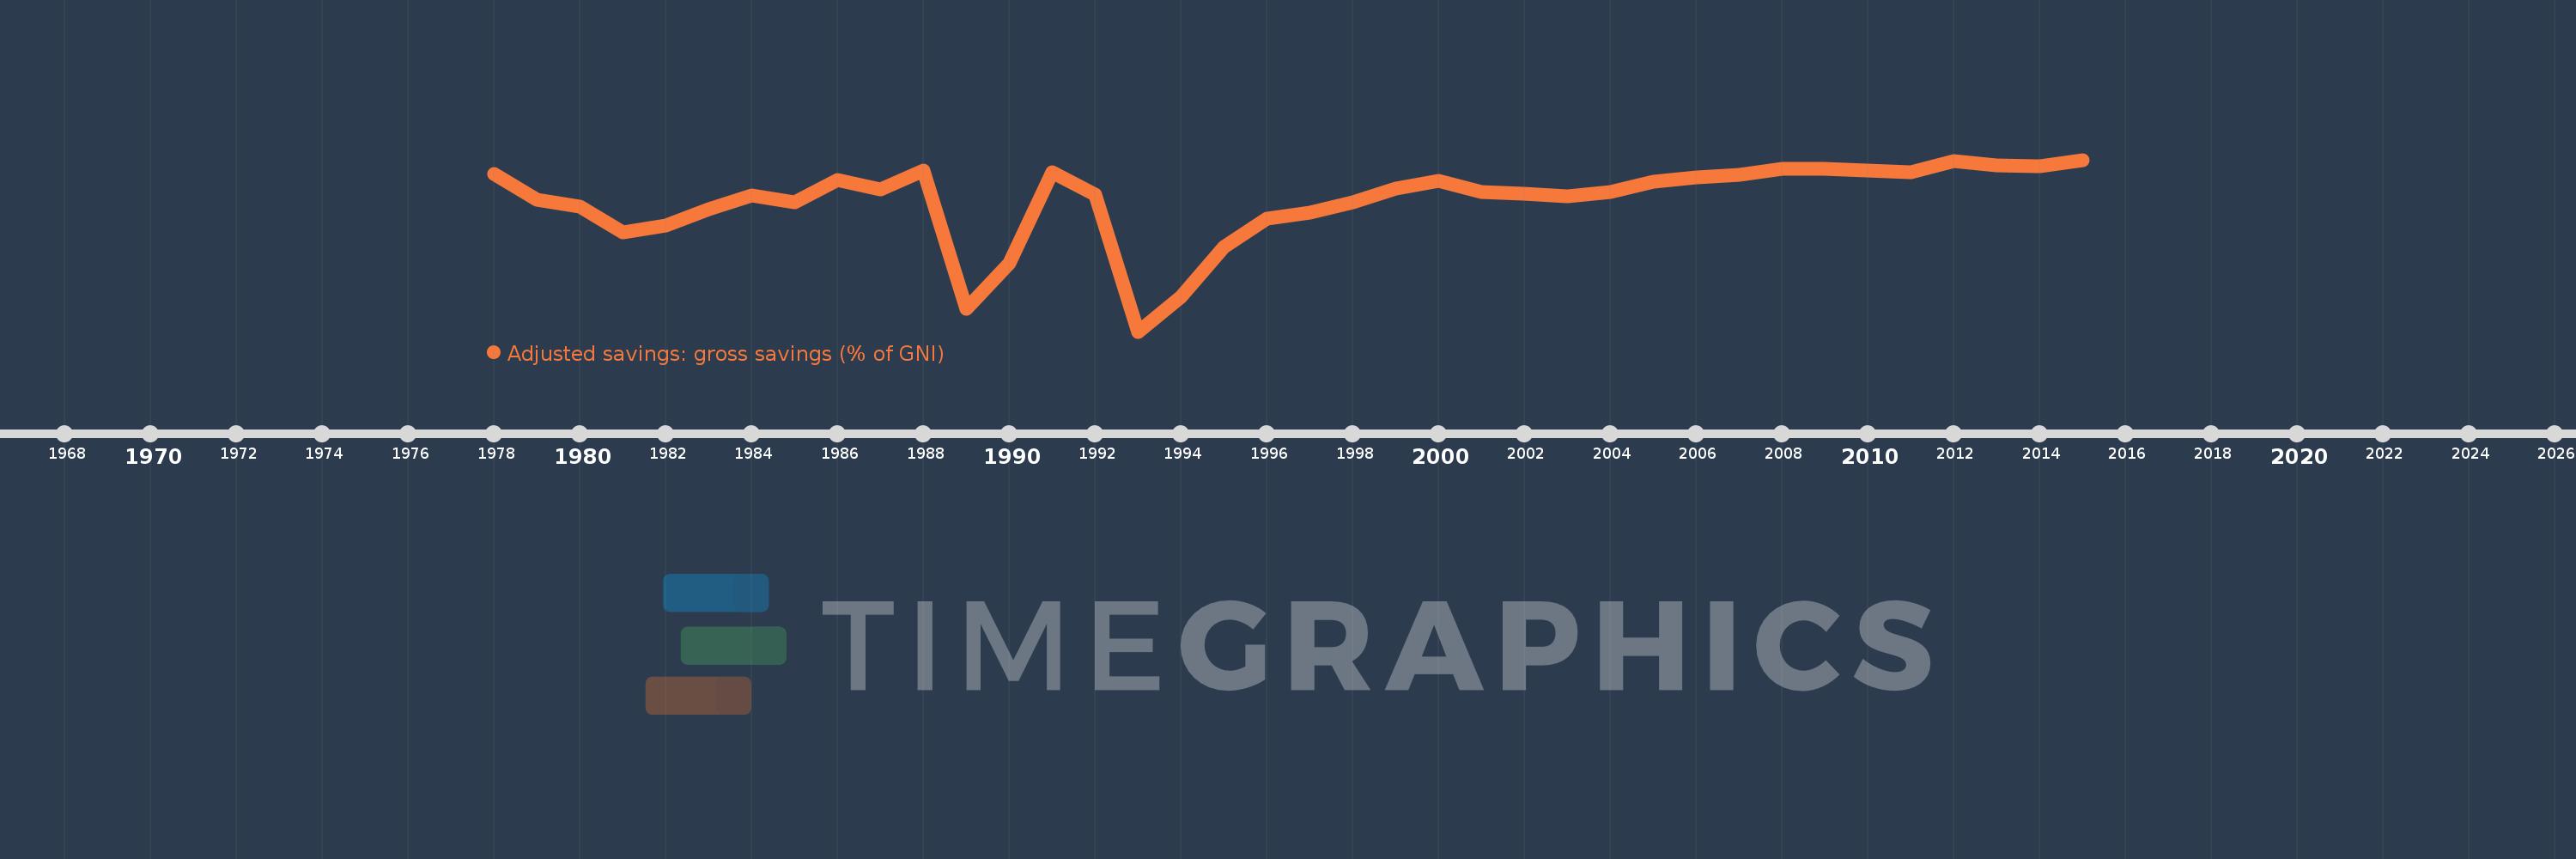
Adjusted savings: gross savings (% of GNI)
2015,2014,2013,2012,2011,2010,2009,2008,2007,2006,2005,2004,2003,2002,2001,2000,1999,1998,1997,1996,1995,1994,1993,1992,1991,1990,1989,1988,1987,1986,1985,1984,1983,1982,1981,1980,1979,1978
This statistics in other country:
AfghanistanAlbaniaAlgeriaAngolaAntigua and BarbudaArab WorldArgentinaArmeniaAustraliaAustriaAzerbaijanBahamas, TheBahrainBangladeshBarbadosBelarusBelgiumBelizeBeninBermudaBhutanBoliviaBosnia and HerzegovinaBotswanaBrazilBrunei DarussalamBulgariaBurkina FasoBurundiCabo VerdeCambodiaCameroonCanadaCaribbean small statesCentral African RepublicCentral Europe and the BalticsChadChileChinaColombiaComorosCongo, Dem. Rep.Congo, Rep.Costa RicaCote d'IvoireCroatiaCyprusCzech RepublicDenmarkDjiboutiDominicaDominican RepublicEarly-demographic dividendEast Asia & PacificEast Asia & Pacific (excluding high income)East Asia & Pacific (IDA & IBRD countries)EcuadorEgypt, Arab Rep.El SalvadorEquatorial GuineaEritreaEstoniaEthiopiaEuro areaEurope & Central AsiaEurope & Central Asia (excluding high income)Europe & Central Asia (IDA & IBRD countries)European UnionFaroe IslandsFijiFinlandFragile and conflict affected situationsFranceGabonGambia, TheGeorgiaGermanyGhanaGreeceGrenadaGuatemalaGuineaGuinea-BissauGuyanaHaitiHeavily indebted poor countries (HIPC)High incomeHondurasHong Kong SAR, ChinaHungaryIBRD onlyIcelandIDA & IBRD totalIDA blendIDA onlyIDA totalIndiaIndonesiaIran, Islamic Rep.IraqIrelandIsraelItalyJamaicaJapanJordanKazakhstanKenyaKiribatiKorea, Rep.KosovoKuwaitKyrgyz RepublicLao PDRLate-demographic dividendLatin America & Caribbean Latin America & Caribbean (excluding high income)Latin America & the Caribbean (IDA & IBRD countries)LatviaLeast developed countries: UN classificationLebanonLesothoLiberiaLibyaLithuaniaLow & middle incomeLow incomeLower middle incomeLuxembourgMacao SAR, ChinaMacedonia, FYRMadagascarMalawiMalaysiaMaldivesMaliMaltaMauritaniaMauritiusMexicoMiddle East & North AfricaMiddle East & North Africa (excluding high income)Middle East & North Africa (IDA & IBRD countries)Middle incomeMoldovaMongoliaMontenegroMoroccoMozambiqueNamibiaNepalNetherlandsNew ZealandNicaraguaNigerNigeriaNorth AmericaNorwayOECD membersOmanOther small statesPacific island small statesPakistanPanamaPapua New GuineaParaguayPeruPhilippinesPolandPortugalPost-demographic dividendPre-demographic dividendQatarRomaniaRussian FederationRwandaSaudi ArabiaSenegalSerbiaSeychellesSierra LeoneSingaporeSlovak RepublicSloveniaSmall statesSolomon IslandsSouth AfricaSouth AsiaSouth Asia (IDA & IBRD)SpainSri LankaSt. Kitts and NevisSt. LuciaSt. Vincent and the GrenadinesSub-Saharan Africa Sub-Saharan Africa (excluding high income)Sub-Saharan Africa (IDA & IBRD countries)SudanSurinameSwazilandSwedenSwitzerlandSyrian Arab RepublicTajikistanTanzaniaThailandTimor-LesteTogoTongaTrinidad and TobagoTunisiaTurkeyTurkmenistanUgandaUkraineUnited KingdomUnited StatesUpper middle incomeUruguayVanuatuVenezuela, RBVietnamWest Bank and GazaWorldYemen, Rep.ZambiaZimbabwe Timeline:
This timeline shows a graph from 1978 to 2015 of Nicaragua. No data until 1977. Number of actual observations by date: 38.
Source name:
World Development Indicators
Source organization:
World Bank national accounts data files.
Categories, topics:
Economy & Growth, Environment
Last updated:
apr 23, 2017
Indicators value changes by year
Minimum:
-33.169
jan 1, 1993
Maximum:
19.885
jan 1, 2015
At the date of observation
Value
Absolute change
Change from previous value
jan 1, 1978
15.397
+15.397
0.0%
jan 1, 1979
7.563
-7.835
-50.88%
jan 1, 1980
5.464
-2.098
-27.75%
jan 1, 1981
-2.468
-7.933
-145.18%
jan 1, 1982
-0.311
+2.157
-87.38%
jan 1, 1983
4.637
+4.948
-1.59K%
jan 1, 1984
8.915
+4.278
92.27%
jan 1, 1985
6.647
-2.268
-25.44%
jan 1, 1986
13.695
+7.048
106.03%
jan 1, 1987
10.702
-2.992
-21.85%
jan 1, 1988
16.573
+5.871
54.86%
jan 1, 1989
-26.204
-42.778
-258.11%
jan 1, 1990
-11.99
+14.214
-54.24%
jan 1, 1991
16.05
+28.04
-233.86%
jan 1, 1992
9.271
-6.779
-42.24%
jan 1, 1993
-33.169
-42.441
-457.77%
jan 1, 1994
-22.494
+10.676
-32.19%
jan 1, 1995
-7.129
+15.365
-68.31%
jan 1, 1996
1.608
+8.736
-122.55%
jan 1, 1997
3.615
+2.008
124.88%
jan 1, 1998
6.851
+3.236
89.51%
jan 1, 1999
11.072
+4.221
61.61%
jan 1, 2000
13.495
+2.423
21.88%
jan 1, 2001
10.05
-3.445
-25.53%
jan 1, 2002
9.447
-0.603
-6.0%
jan 1, 2003
8.583
-0.864
-9.15%
jan 1, 2004
9.88
+1.297
15.11%
jan 1, 2005
13.185
+3.305
33.46%
jan 1, 2006
14.539
+1.354
10.27%
jan 1, 2007
15.274
+0.734
5.05%
jan 1, 2008
17.064
+1.79
11.72%
jan 1, 2009
17.134
+0.07
0.41%
jan 1, 2010
16.64
-0.494
-2.88%
jan 1, 2011
16.063
-0.577
-3.47%
jan 1, 2012
19.578
+3.515
21.88%
jan 1, 2013
18.286
-1.292
-6.6%
jan 1, 2014
17.876
-0.411
-2.25%
jan 1, 2015
19.885
+2.01
11.24%
Ranking of countries by current statistics by years


Comments: