29
/
en
AIzaSyAYiBZKx7MnpbEhh9jyipgxe19OcubqV5w
April 1, 2024
56009
Small states
SST
false
2
1
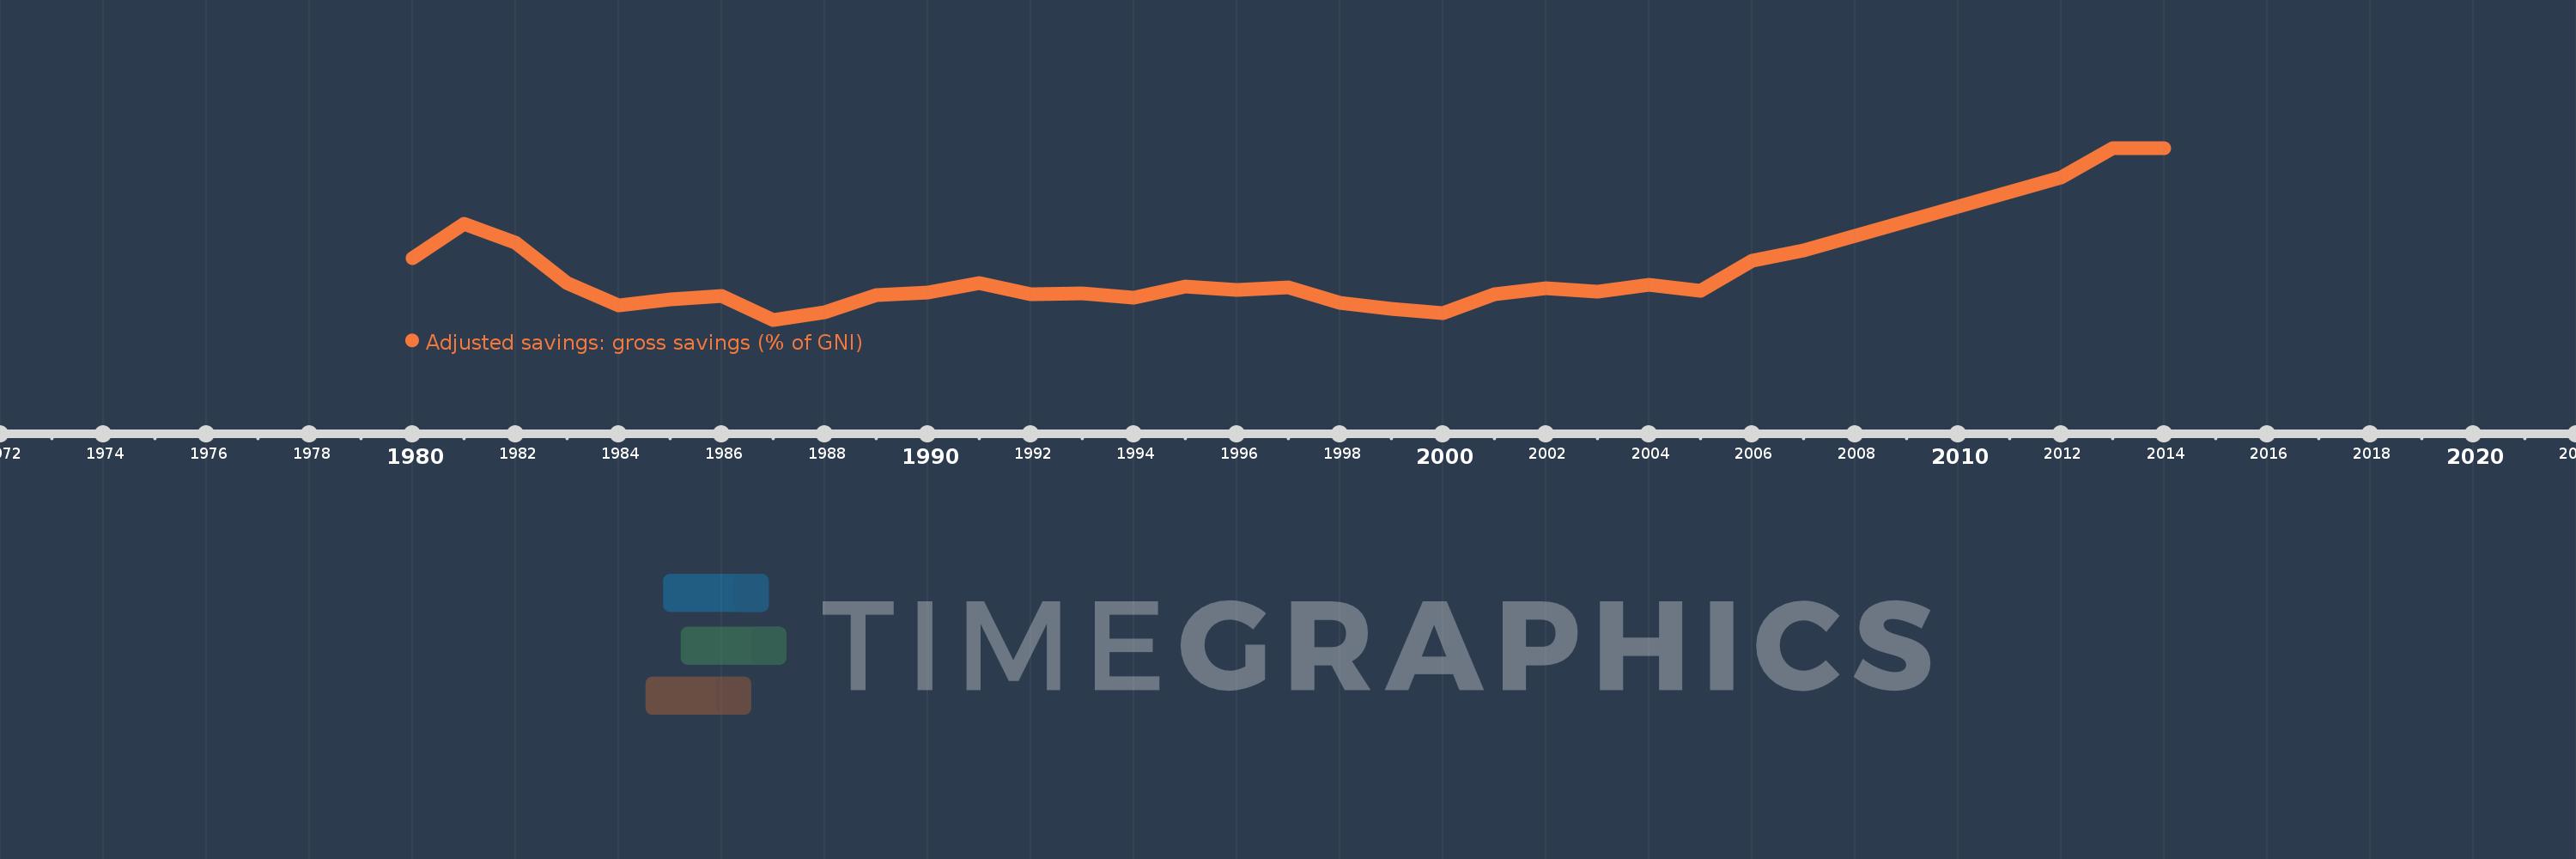
Adjusted savings: gross savings (% of GNI)
2014,2013,2012,2007,2006,2005,2004,2003,2002,2001,2000,1999,1998,1997,1996,1995,1994,1993,1992,1991,1990,1989,1988,1987,1986,1985,1984,1983,1982,1981,1980
This statistics in other country:
AfghanistanAlbaniaAlgeriaAngolaAntigua and BarbudaArab WorldArgentinaArmeniaAustraliaAustriaAzerbaijanBahamas, TheBahrainBangladeshBarbadosBelarusBelgiumBelizeBeninBermudaBhutanBoliviaBosnia and HerzegovinaBotswanaBrazilBrunei DarussalamBulgariaBurkina FasoBurundiCabo VerdeCambodiaCameroonCanadaCaribbean small statesCentral African RepublicCentral Europe and the BalticsChadChileChinaColombiaComorosCongo, Dem. Rep.Congo, Rep.Costa RicaCote d'IvoireCroatiaCyprusCzech RepublicDenmarkDjiboutiDominicaDominican RepublicEarly-demographic dividendEast Asia & PacificEast Asia & Pacific (excluding high income)East Asia & Pacific (IDA & IBRD countries)EcuadorEgypt, Arab Rep.El SalvadorEquatorial GuineaEritreaEstoniaEthiopiaEuro areaEurope & Central AsiaEurope & Central Asia (excluding high income)Europe & Central Asia (IDA & IBRD countries)European UnionFaroe IslandsFijiFinlandFragile and conflict affected situationsFranceGabonGambia, TheGeorgiaGermanyGhanaGreeceGrenadaGuatemalaGuineaGuinea-BissauGuyanaHaitiHeavily indebted poor countries (HIPC)High incomeHondurasHong Kong SAR, ChinaHungaryIBRD onlyIcelandIDA & IBRD totalIDA blendIDA onlyIDA totalIndiaIndonesiaIran, Islamic Rep.IraqIrelandIsraelItalyJamaicaJapanJordanKazakhstanKenyaKiribatiKorea, Rep.KosovoKuwaitKyrgyz RepublicLao PDRLate-demographic dividendLatin America & Caribbean Latin America & Caribbean (excluding high income)Latin America & the Caribbean (IDA & IBRD countries)LatviaLeast developed countries: UN classificationLebanonLesothoLiberiaLibyaLithuaniaLow & middle incomeLow incomeLower middle incomeLuxembourgMacao SAR, ChinaMacedonia, FYRMadagascarMalawiMalaysiaMaldivesMaliMaltaMauritaniaMauritiusMexicoMiddle East & North AfricaMiddle East & North Africa (excluding high income)Middle East & North Africa (IDA & IBRD countries)Middle incomeMoldovaMongoliaMontenegroMoroccoMozambiqueNamibiaNepalNetherlandsNew ZealandNicaraguaNigerNigeriaNorth AmericaNorwayOECD membersOmanOther small statesPacific island small statesPakistanPanamaPapua New GuineaParaguayPeruPhilippinesPolandPortugalPost-demographic dividendPre-demographic dividendQatarRomaniaRussian FederationRwandaSaudi ArabiaSenegalSerbiaSeychellesSierra LeoneSingaporeSlovak RepublicSloveniaSmall statesSolomon IslandsSouth AfricaSouth AsiaSouth Asia (IDA & IBRD)SpainSri LankaSt. Kitts and NevisSt. LuciaSt. Vincent and the GrenadinesSub-Saharan Africa Sub-Saharan Africa (excluding high income)Sub-Saharan Africa (IDA & IBRD countries)SudanSurinameSwazilandSwedenSwitzerlandSyrian Arab RepublicTajikistanTanzaniaThailandTimor-LesteTogoTongaTrinidad and TobagoTunisiaTurkeyTurkmenistanUgandaUkraineUnited KingdomUnited StatesUpper middle incomeUruguayVanuatuVenezuela, RBVietnamWest Bank and GazaWorldYemen, Rep.ZambiaZimbabwe Timeline:
This timeline shows a graph from 1980 to 2014 of Small states. No data until 1979. Number of actual observations by date: 31.
Source name:
World Development Indicators
Source organization:
World Bank national accounts data files.
Categories, topics:
Economy & Growth, Environment
Last updated:
apr 23, 2017
Indicators value changes by year
Maximum:
43.057
jan 1, 2014
At the date of observation
Value
Absolute change
Change from previous value
jan 1, 1980
28.146
+28.146
0.0%
jan 1, 1981
32.768
+4.622
16.42%
jan 1, 1982
30.225
-2.542
-7.76%
jan 1, 1983
24.754
-5.471
-18.1%
jan 1, 1984
21.816
-2.938
-11.87%
jan 1, 1985
22.52
+0.704
3.23%
jan 1, 1986
22.991
+0.471
2.09%
jan 1, 1987
19.82
-3.171
-13.79%
jan 1, 1988
20.856
+1.036
5.23%
jan 1, 1989
23.193
+2.336
11.2%
jan 1, 1990
23.473
+0.28
1.21%
jan 1, 1991
24.752
+1.279
5.45%
jan 1, 1992
23.314
-1.438
-5.81%
jan 1, 1993
23.399
+0.085
0.37%
jan 1, 1994
22.863
-0.536
-2.29%
jan 1, 1995
24.301
+1.438
6.29%
jan 1, 1996
23.846
-0.456
-1.88%
jan 1, 1997
24.193
+0.347
1.46%
jan 1, 1998
22.153
-2.04
-8.43%
jan 1, 1999
21.261
-0.892
-4.03%
jan 1, 2000
20.766
-0.495
-2.33%
jan 1, 2001
23.285
+2.519
12.13%
jan 1, 2002
24.132
+0.848
3.64%
jan 1, 2003
23.619
-0.514
-2.13%
jan 1, 2004
24.585
+0.967
4.09%
jan 1, 2005
23.724
-0.861
-3.5%
jan 1, 2006
27.847
+4.123
17.38%
jan 1, 2007
29.211
+1.364
4.9%
jan 1, 2012
39.112
+9.901
33.89%
jan 1, 2013
43.049
+3.937
10.07%
jan 1, 2014
43.057
+0.007
0.02%
Ranking of countries by current statistics by years


Comments: