29
/
en
AIzaSyAYiBZKx7MnpbEhh9jyipgxe19OcubqV5w
April 1, 2024
100805
Canada
CAN
true
2
1
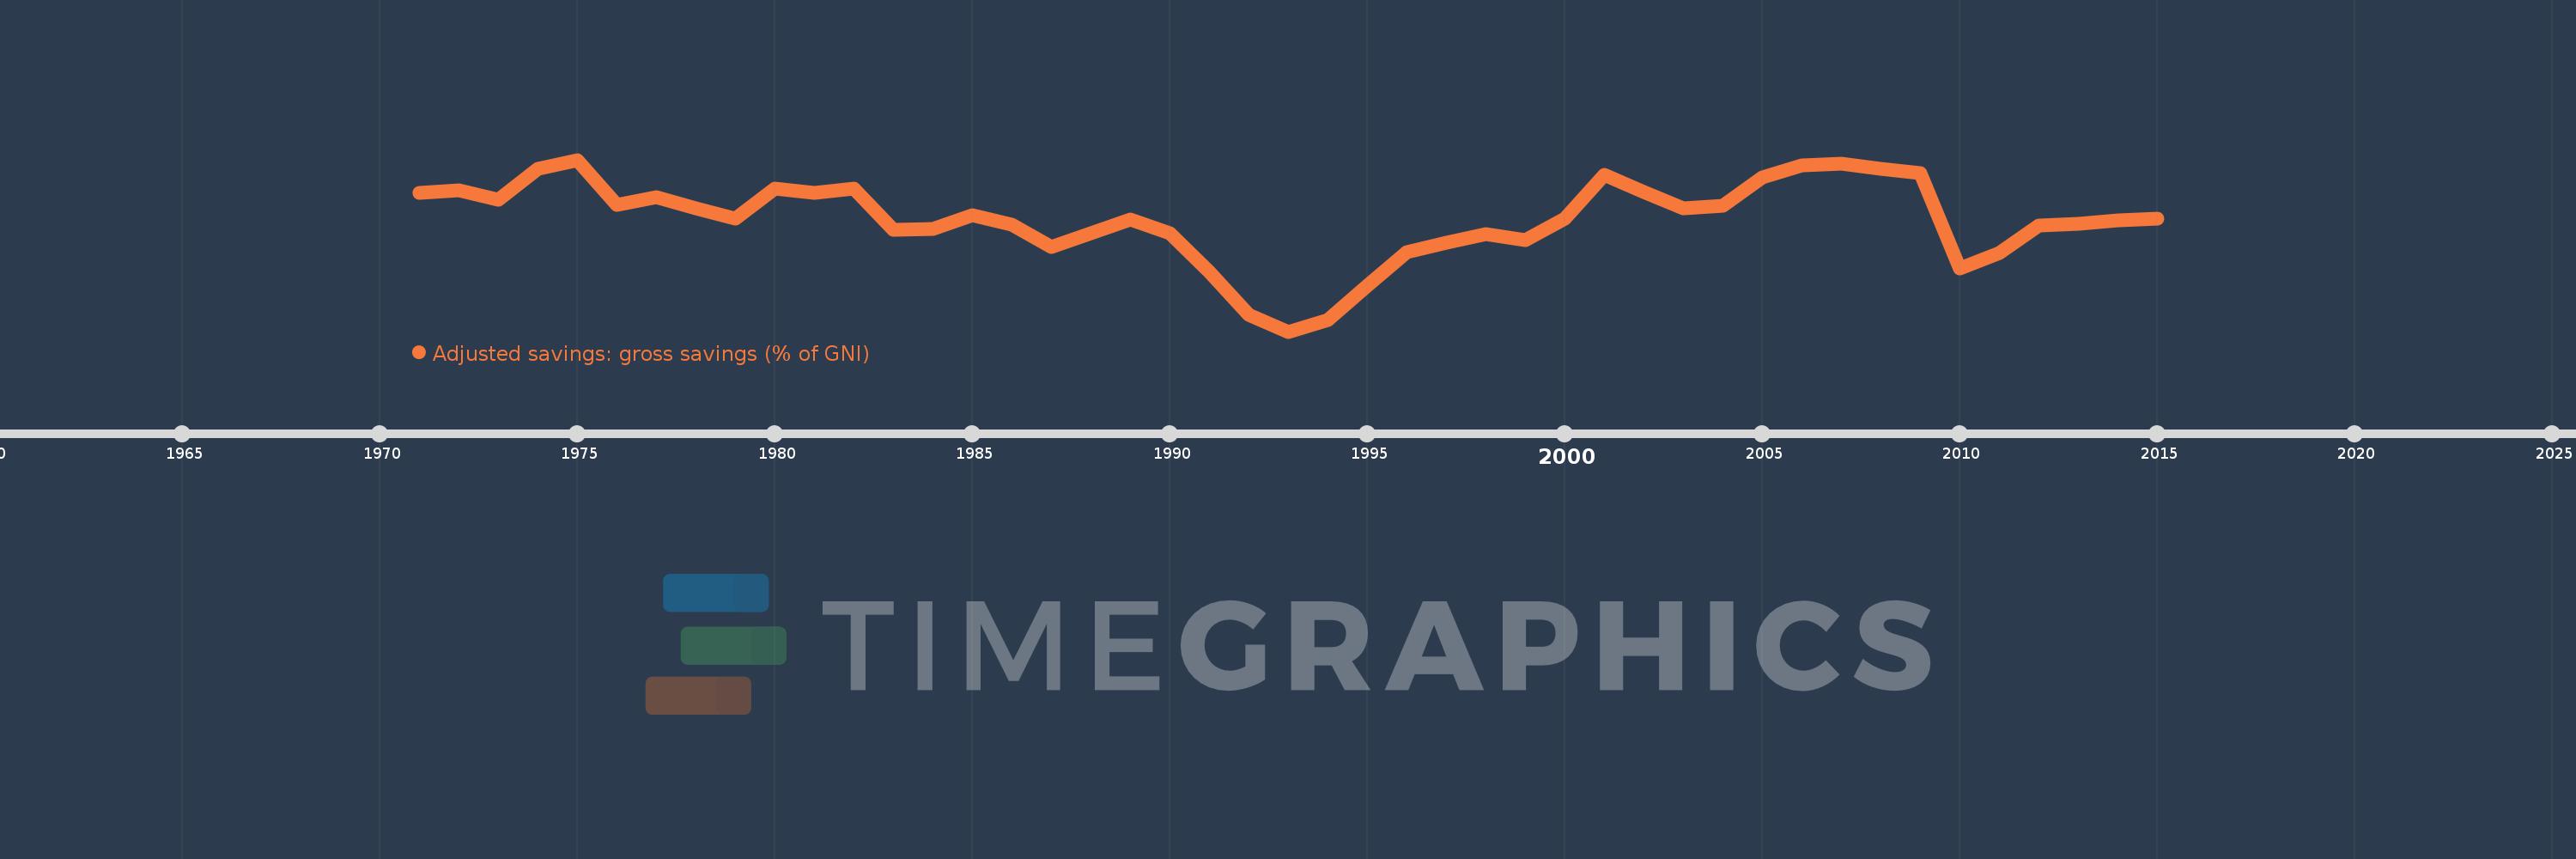
Adjusted savings: gross savings (% of GNI)
2015,2014,2013,2012,2011,2010,2009,2008,2007,2006,2005,2004,2003,2002,2001,2000,1999,1998,1997,1996,1995,1994,1993,1992,1991,1990,1989,1988,1987,1986,1985,1984,1983,1982,1981,1980,1979,1978,1977,1976,1975,1974,1973,1972,1971
This statistics in other country:
AfghanistanAlbaniaAlgeriaAngolaAntigua and BarbudaArab WorldArgentinaArmeniaAustraliaAustriaAzerbaijanBahamas, TheBahrainBangladeshBarbadosBelarusBelgiumBelizeBeninBermudaBhutanBoliviaBosnia and HerzegovinaBotswanaBrazilBrunei DarussalamBulgariaBurkina FasoBurundiCabo VerdeCambodiaCameroonCanadaCaribbean small statesCentral African RepublicCentral Europe and the BalticsChadChileChinaColombiaComorosCongo, Dem. Rep.Congo, Rep.Costa RicaCote d'IvoireCroatiaCyprusCzech RepublicDenmarkDjiboutiDominicaDominican RepublicEarly-demographic dividendEast Asia & PacificEast Asia & Pacific (excluding high income)East Asia & Pacific (IDA & IBRD countries)EcuadorEgypt, Arab Rep.El SalvadorEquatorial GuineaEritreaEstoniaEthiopiaEuro areaEurope & Central AsiaEurope & Central Asia (excluding high income)Europe & Central Asia (IDA & IBRD countries)European UnionFaroe IslandsFijiFinlandFragile and conflict affected situationsFranceGabonGambia, TheGeorgiaGermanyGhanaGreeceGrenadaGuatemalaGuineaGuinea-BissauGuyanaHaitiHeavily indebted poor countries (HIPC)High incomeHondurasHong Kong SAR, ChinaHungaryIBRD onlyIcelandIDA & IBRD totalIDA blendIDA onlyIDA totalIndiaIndonesiaIran, Islamic Rep.IraqIrelandIsraelItalyJamaicaJapanJordanKazakhstanKenyaKiribatiKorea, Rep.KosovoKuwaitKyrgyz RepublicLao PDRLate-demographic dividendLatin America & Caribbean Latin America & Caribbean (excluding high income)Latin America & the Caribbean (IDA & IBRD countries)LatviaLeast developed countries: UN classificationLebanonLesothoLiberiaLibyaLithuaniaLow & middle incomeLow incomeLower middle incomeLuxembourgMacao SAR, ChinaMacedonia, FYRMadagascarMalawiMalaysiaMaldivesMaliMaltaMauritaniaMauritiusMexicoMiddle East & North AfricaMiddle East & North Africa (excluding high income)Middle East & North Africa (IDA & IBRD countries)Middle incomeMoldovaMongoliaMontenegroMoroccoMozambiqueNamibiaNepalNetherlandsNew ZealandNicaraguaNigerNigeriaNorth AmericaNorwayOECD membersOmanOther small statesPacific island small statesPakistanPanamaPapua New GuineaParaguayPeruPhilippinesPolandPortugalPost-demographic dividendPre-demographic dividendQatarRomaniaRussian FederationRwandaSaudi ArabiaSenegalSerbiaSeychellesSierra LeoneSingaporeSlovak RepublicSloveniaSmall statesSolomon IslandsSouth AfricaSouth AsiaSouth Asia (IDA & IBRD)SpainSri LankaSt. Kitts and NevisSt. LuciaSt. Vincent and the GrenadinesSub-Saharan Africa Sub-Saharan Africa (excluding high income)Sub-Saharan Africa (IDA & IBRD countries)SudanSurinameSwazilandSwedenSwitzerlandSyrian Arab RepublicTajikistanTanzaniaThailandTimor-LesteTogoTongaTrinidad and TobagoTunisiaTurkeyTurkmenistanUgandaUkraineUnited KingdomUnited StatesUpper middle incomeUruguayVanuatuVenezuela, RBVietnamWest Bank and GazaWorldYemen, Rep.ZambiaZimbabwe Timeline:
This timeline shows a graph from 1971 to 2015 of Canada. No data until 1970. Number of actual observations by date: 45.
Source name:
World Development Indicators
Source organization:
World Bank national accounts data files.
Categories, topics:
Economy & Growth, Environment
Last updated:
apr 23, 2017
Indicators value changes by year
Minimum:
14.864
jan 1, 1993
Maximum:
25.362
jan 1, 1975
At the date of observation
Value
Absolute change
Change from previous value
jan 1, 1971
23.335
+23.335
0.0%
jan 1, 1972
23.477
+0.142
0.61%
jan 1, 1973
22.932
-0.545
-2.32%
jan 1, 1974
24.815
+1.883
8.21%
jan 1, 1975
25.362
+0.547
2.21%
jan 1, 1976
22.597
-2.765
-10.9%
jan 1, 1977
23.065
+0.468
2.07%
jan 1, 1978
22.371
-0.695
-3.01%
jan 1, 1979
21.745
-0.626
-2.8%
jan 1, 1980
23.601
+1.857
8.54%
jan 1, 1981
23.339
-0.262
-1.11%
jan 1, 1982
23.599
+0.26
1.11%
jan 1, 1983
21.085
-2.515
-10.66%
jan 1, 1984
21.118
+0.034
0.16%
jan 1, 1985
21.993
+0.874
4.14%
jan 1, 1986
21.403
-0.59
-2.68%
jan 1, 1987
20.041
-1.362
-6.36%
jan 1, 1988
20.885
+0.844
4.21%
jan 1, 1989
21.688
+0.803
3.85%
jan 1, 1990
20.885
-0.803
-3.7%
jan 1, 1991
18.492
-2.393
-11.46%
jan 1, 1992
15.893
-2.599
-14.06%
jan 1, 1993
14.864
-1.029
-6.47%
jan 1, 1994
15.557
+0.693
4.66%
jan 1, 1995
17.673
+2.116
13.6%
jan 1, 1996
19.725
+2.053
11.61%
jan 1, 1997
20.271
+0.546
2.77%
jan 1, 1998
20.809
+0.537
2.65%
jan 1, 1999
20.433
-0.376
-1.81%
jan 1, 2000
21.76
+1.327
6.5%
jan 1, 2001
24.443
+2.684
12.33%
jan 1, 2002
23.413
-1.031
-4.22%
jan 1, 2003
22.379
-1.034
-4.41%
jan 1, 2004
22.531
+0.151
0.68%
jan 1, 2005
24.279
+1.748
7.76%
jan 1, 2006
25.047
+0.768
3.16%
jan 1, 2007
25.124
+0.078
0.31%
jan 1, 2008
24.83
-0.294
-1.17%
jan 1, 2009
24.558
-0.273
-1.1%
jan 1, 2010
18.71
-5.847
-23.81%
jan 1, 2011
19.684
+0.974
5.2%
jan 1, 2012
21.332
+1.648
8.37%
jan 1, 2013
21.457
+0.126
0.59%
jan 1, 2014
21.65
+0.193
0.9%
jan 1, 2015
21.79
+0.139
0.64%
Ranking of countries by current statistics by years


Comments: