29
/
en
AIzaSyAYiBZKx7MnpbEhh9jyipgxe19OcubqV5w
April 1, 2024
104517
Chile
CHL
true
2
1
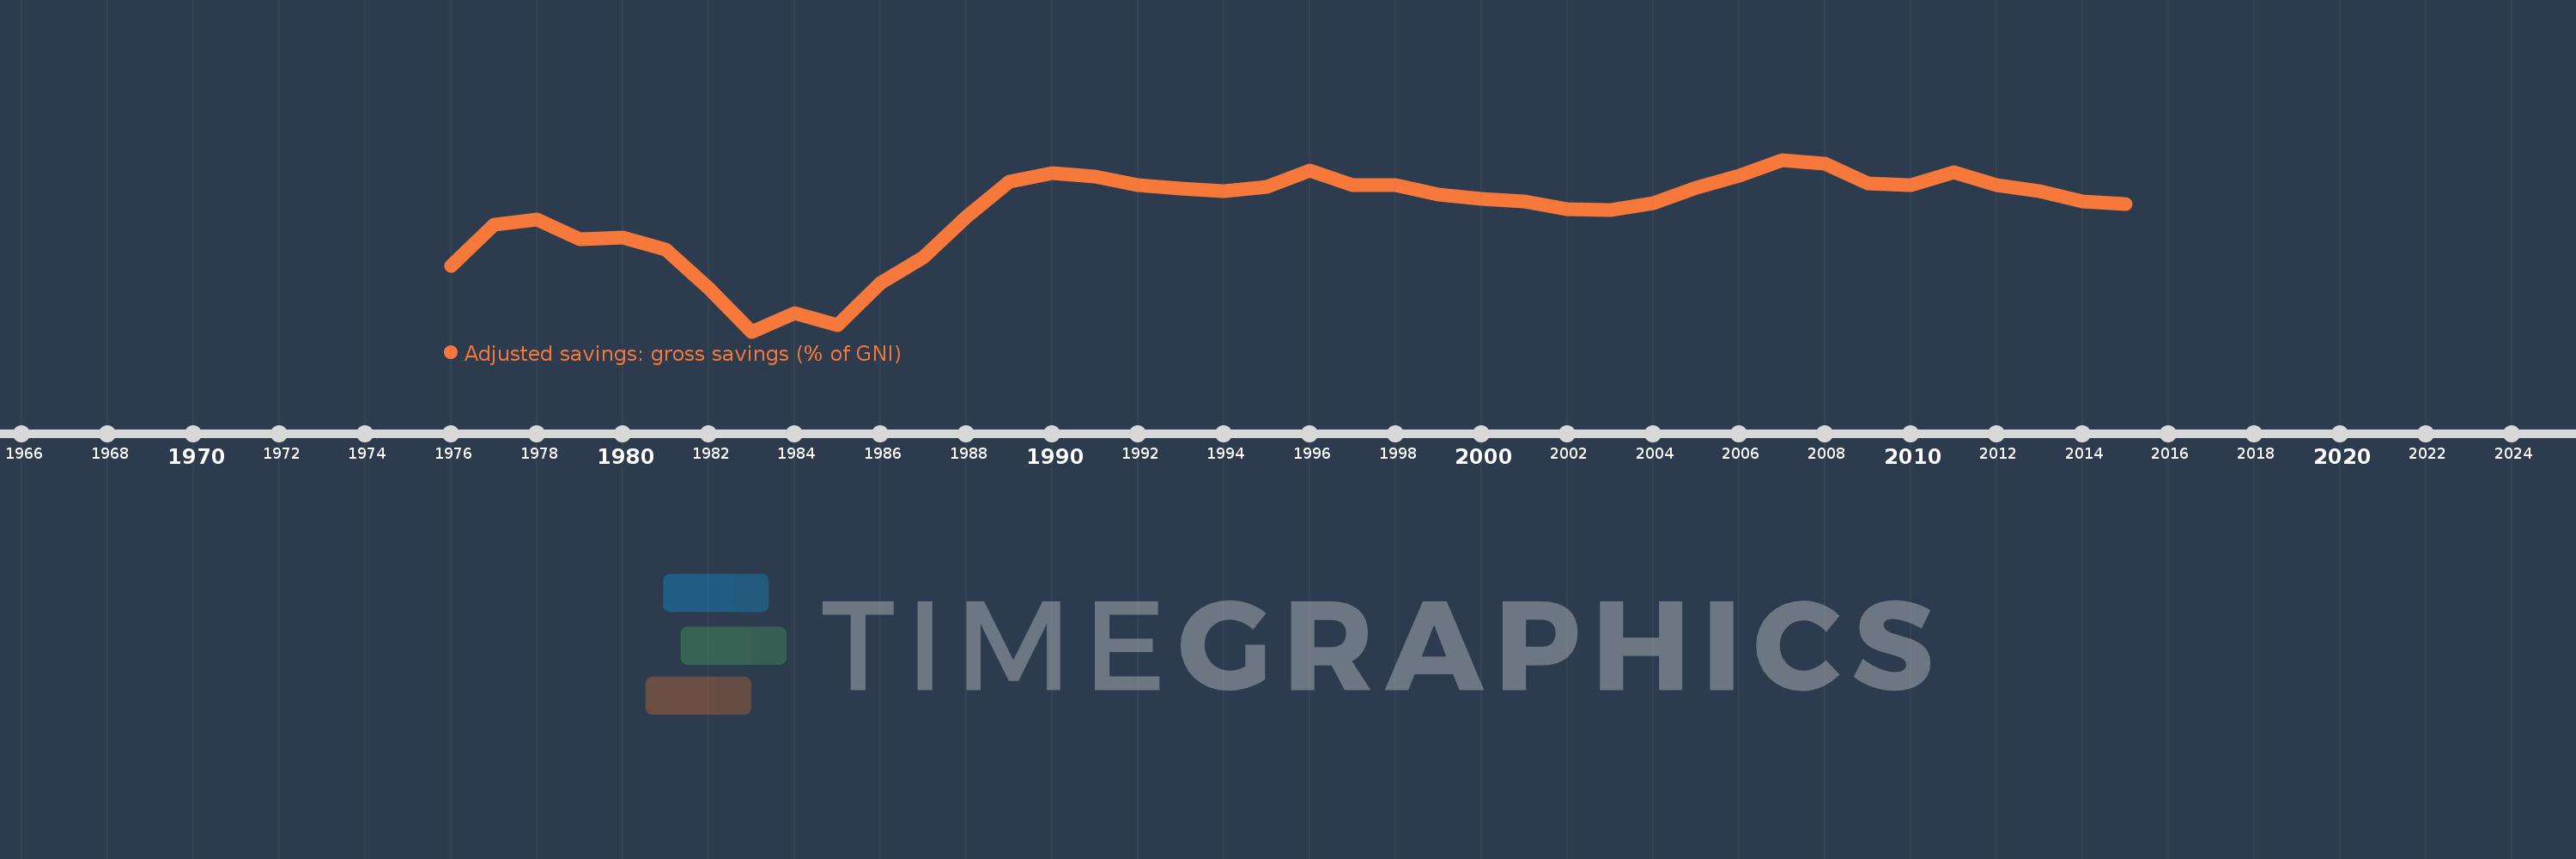
Adjusted savings: gross savings (% of GNI)
2015,2014,2013,2012,2011,2010,2009,2008,2007,2006,2005,2004,2003,2002,2001,2000,1999,1998,1997,1996,1995,1994,1993,1992,1991,1990,1989,1988,1987,1986,1985,1984,1983,1982,1981,1980,1979,1978,1977,1976
This statistics in other country:
AfghanistanAlbaniaAlgeriaAngolaAntigua and BarbudaArab WorldArgentinaArmeniaAustraliaAustriaAzerbaijanBahamas, TheBahrainBangladeshBarbadosBelarusBelgiumBelizeBeninBermudaBhutanBoliviaBosnia and HerzegovinaBotswanaBrazilBrunei DarussalamBulgariaBurkina FasoBurundiCabo VerdeCambodiaCameroonCanadaCaribbean small statesCentral African RepublicCentral Europe and the BalticsChadChileChinaColombiaComorosCongo, Dem. Rep.Congo, Rep.Costa RicaCote d'IvoireCroatiaCyprusCzech RepublicDenmarkDjiboutiDominicaDominican RepublicEarly-demographic dividendEast Asia & PacificEast Asia & Pacific (excluding high income)East Asia & Pacific (IDA & IBRD countries)EcuadorEgypt, Arab Rep.El SalvadorEquatorial GuineaEritreaEstoniaEthiopiaEuro areaEurope & Central AsiaEurope & Central Asia (excluding high income)Europe & Central Asia (IDA & IBRD countries)European UnionFaroe IslandsFijiFinlandFragile and conflict affected situationsFranceGabonGambia, TheGeorgiaGermanyGhanaGreeceGrenadaGuatemalaGuineaGuinea-BissauGuyanaHaitiHeavily indebted poor countries (HIPC)High incomeHondurasHong Kong SAR, ChinaHungaryIBRD onlyIcelandIDA & IBRD totalIDA blendIDA onlyIDA totalIndiaIndonesiaIran, Islamic Rep.IraqIrelandIsraelItalyJamaicaJapanJordanKazakhstanKenyaKiribatiKorea, Rep.KosovoKuwaitKyrgyz RepublicLao PDRLate-demographic dividendLatin America & Caribbean Latin America & Caribbean (excluding high income)Latin America & the Caribbean (IDA & IBRD countries)LatviaLeast developed countries: UN classificationLebanonLesothoLiberiaLibyaLithuaniaLow & middle incomeLow incomeLower middle incomeLuxembourgMacao SAR, ChinaMacedonia, FYRMadagascarMalawiMalaysiaMaldivesMaliMaltaMauritaniaMauritiusMexicoMiddle East & North AfricaMiddle East & North Africa (excluding high income)Middle East & North Africa (IDA & IBRD countries)Middle incomeMoldovaMongoliaMontenegroMoroccoMozambiqueNamibiaNepalNetherlandsNew ZealandNicaraguaNigerNigeriaNorth AmericaNorwayOECD membersOmanOther small statesPacific island small statesPakistanPanamaPapua New GuineaParaguayPeruPhilippinesPolandPortugalPost-demographic dividendPre-demographic dividendQatarRomaniaRussian FederationRwandaSaudi ArabiaSenegalSerbiaSeychellesSierra LeoneSingaporeSlovak RepublicSloveniaSmall statesSolomon IslandsSouth AfricaSouth AsiaSouth Asia (IDA & IBRD)SpainSri LankaSt. Kitts and NevisSt. LuciaSt. Vincent and the GrenadinesSub-Saharan Africa Sub-Saharan Africa (excluding high income)Sub-Saharan Africa (IDA & IBRD countries)SudanSurinameSwazilandSwedenSwitzerlandSyrian Arab RepublicTajikistanTanzaniaThailandTimor-LesteTogoTongaTrinidad and TobagoTunisiaTurkeyTurkmenistanUgandaUkraineUnited KingdomUnited StatesUpper middle incomeUruguayVanuatuVenezuela, RBVietnamWest Bank and GazaWorldYemen, Rep.ZambiaZimbabwe Timeline:
This timeline shows a graph from 1976 to 2015 of Chile. No data until 1975. Number of actual observations by date: 40.
Source name:
World Development Indicators
Source organization:
World Bank national accounts data files.
Categories, topics:
Economy & Growth, Environment
Last updated:
apr 23, 2017
Indicators value changes by year
At the date of observation
Value
Absolute change
Change from previous value
jan 1, 1976
11.613
+11.613
0.0%
jan 1, 1977
17.8
+6.187
53.27%
jan 1, 1978
18.595
+0.796
4.47%
jan 1, 1979
15.537
-3.059
-16.45%
jan 1, 1980
15.902
+0.366
2.35%
jan 1, 1981
14.068
-1.834
-11.53%
jan 1, 1982
8.203
-5.865
-41.69%
jan 1, 1983
1.618
-6.585
-80.28%
jan 1, 1984
4.354
+2.736
169.09%
jan 1, 1985
2.63
-1.724
-39.6%
jan 1, 1986
9.02
+6.391
243.03%
jan 1, 1987
12.898
+3.878
42.99%
jan 1, 1988
18.944
+6.046
46.87%
jan 1, 1989
24.346
+5.402
28.52%
jan 1, 1990
25.582
+1.236
5.08%
jan 1, 1991
25.067
-0.515
-2.01%
jan 1, 1992
23.76
-1.308
-5.22%
jan 1, 1993
23.312
-0.448
-1.88%
jan 1, 1994
22.846
-0.467
-2.0%
jan 1, 1995
23.581
+0.735
3.22%
jan 1, 1996
26.003
+2.422
10.27%
jan 1, 1997
23.846
-2.157
-8.29%
jan 1, 1998
23.808
-0.038
-0.16%
jan 1, 1999
22.367
-1.441
-6.05%
jan 1, 2000
21.666
-0.701
-3.14%
jan 1, 2001
21.297
-0.369
-1.7%
jan 1, 2002
20.081
-1.215
-5.71%
jan 1, 2003
20.07
-0.011
-0.06%
jan 1, 2004
21.106
+1.036
5.16%
jan 1, 2005
23.405
+2.3
10.9%
jan 1, 2006
25.243
+1.837
7.85%
jan 1, 2007
27.62
+2.378
9.42%
jan 1, 2008
27.027
-0.593
-2.15%
jan 1, 2009
24.107
-2.92
-10.81%
jan 1, 2010
23.837
-0.27
-1.12%
jan 1, 2011
25.707
+1.87
7.85%
jan 1, 2012
23.796
-1.911
-7.43%
jan 1, 2013
22.829
-0.967
-4.06%
jan 1, 2014
21.37
-1.46
-6.39%
jan 1, 2015
20.912
-0.458
-2.14%
Ranking of countries by current statistics by years


Comments: