29
/
en
AIzaSyAYiBZKx7MnpbEhh9jyipgxe19OcubqV5w
April 1, 2024
44790
Low & middle income
LMY
false
2
1
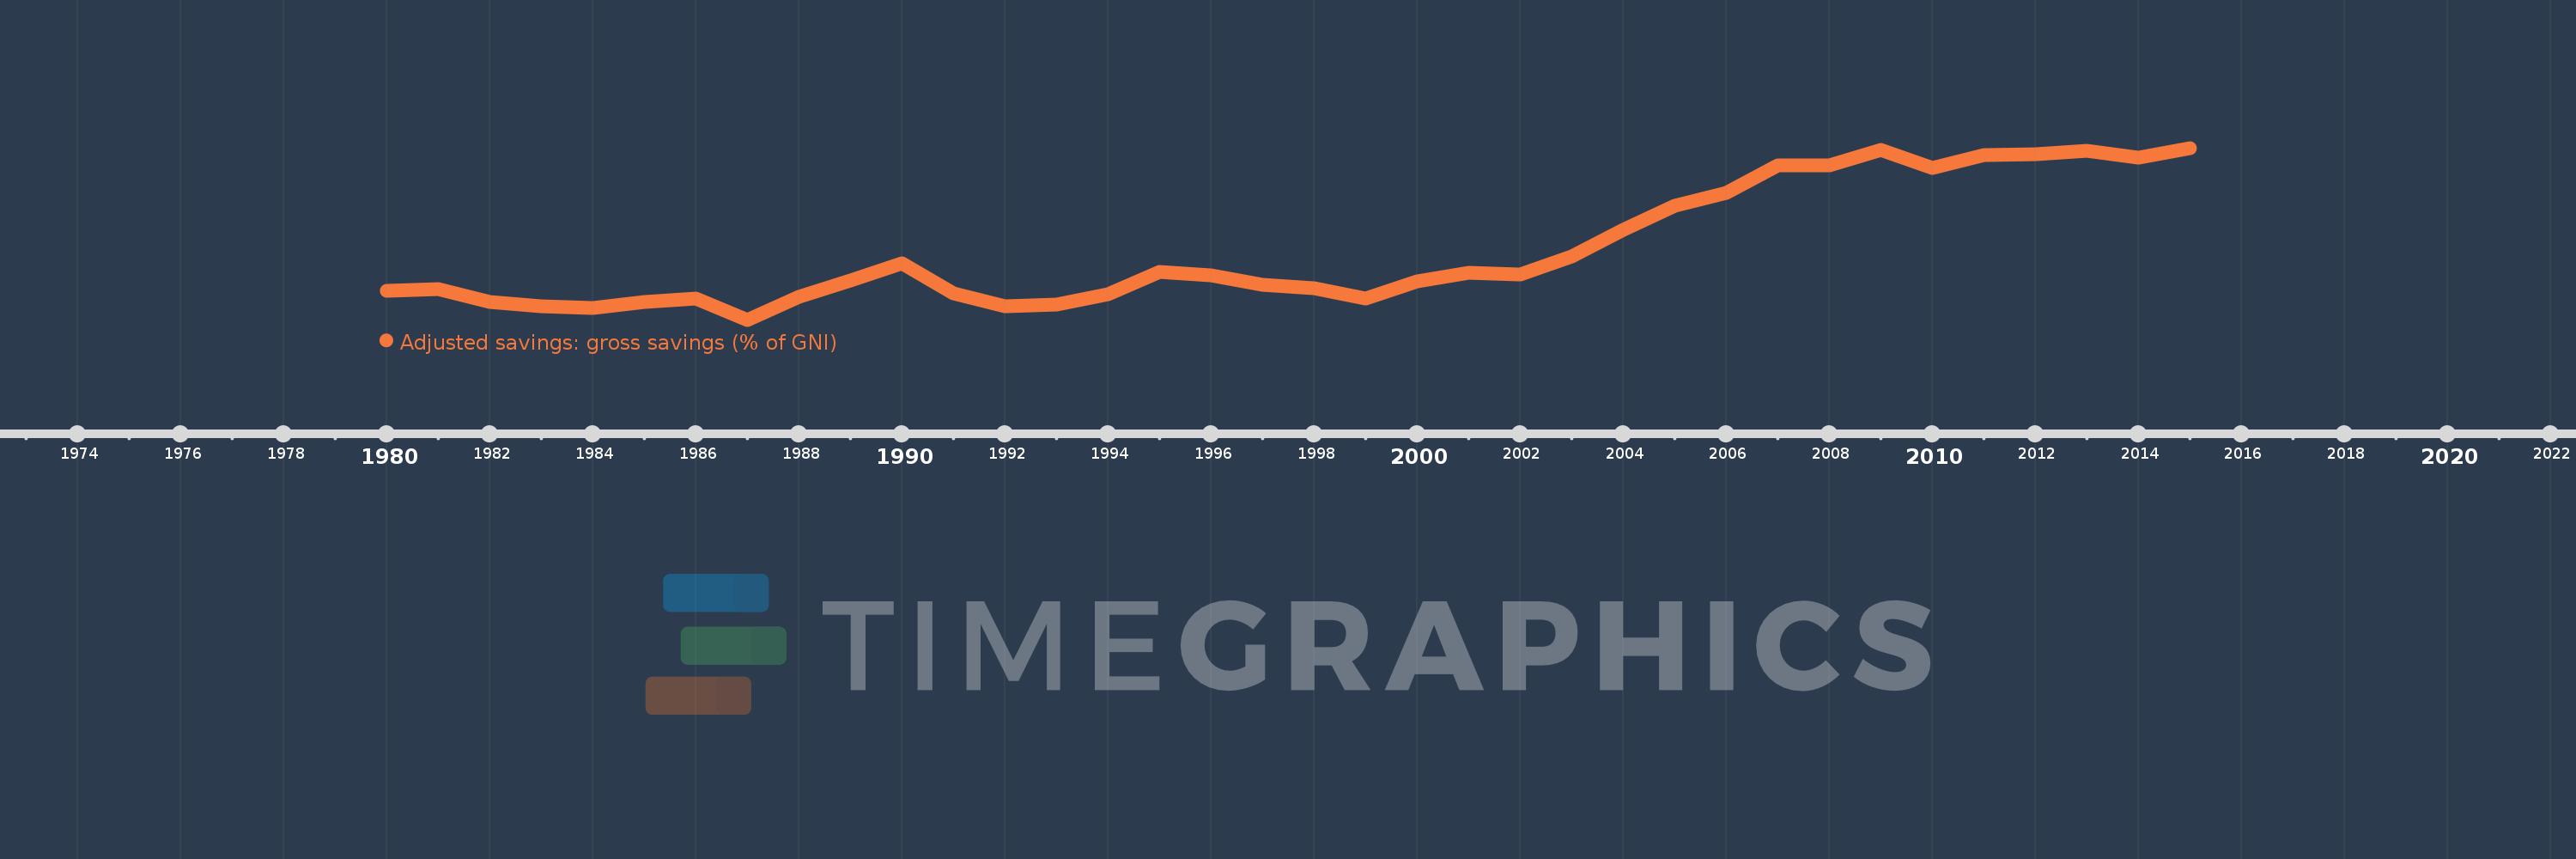
Adjusted savings: gross savings (% of GNI)
2015,2014,2013,2012,2011,2010,2009,2008,2007,2006,2005,2004,2003,2002,2001,2000,1999,1998,1997,1996,1995,1994,1993,1992,1991,1990,1989,1988,1987,1986,1985,1984,1983,1982,1981,1980
This statistics in other country:
AfghanistanAlbaniaAlgeriaAngolaAntigua and BarbudaArab WorldArgentinaArmeniaAustraliaAustriaAzerbaijanBahamas, TheBahrainBangladeshBarbadosBelarusBelgiumBelizeBeninBermudaBhutanBoliviaBosnia and HerzegovinaBotswanaBrazilBrunei DarussalamBulgariaBurkina FasoBurundiCabo VerdeCambodiaCameroonCanadaCaribbean small statesCentral African RepublicCentral Europe and the BalticsChadChileChinaColombiaComorosCongo, Dem. Rep.Congo, Rep.Costa RicaCote d'IvoireCroatiaCyprusCzech RepublicDenmarkDjiboutiDominicaDominican RepublicEarly-demographic dividendEast Asia & PacificEast Asia & Pacific (excluding high income)East Asia & Pacific (IDA & IBRD countries)EcuadorEgypt, Arab Rep.El SalvadorEquatorial GuineaEritreaEstoniaEthiopiaEuro areaEurope & Central AsiaEurope & Central Asia (excluding high income)Europe & Central Asia (IDA & IBRD countries)European UnionFaroe IslandsFijiFinlandFragile and conflict affected situationsFranceGabonGambia, TheGeorgiaGermanyGhanaGreeceGrenadaGuatemalaGuineaGuinea-BissauGuyanaHaitiHeavily indebted poor countries (HIPC)High incomeHondurasHong Kong SAR, ChinaHungaryIBRD onlyIcelandIDA & IBRD totalIDA blendIDA onlyIDA totalIndiaIndonesiaIran, Islamic Rep.IraqIrelandIsraelItalyJamaicaJapanJordanKazakhstanKenyaKiribatiKorea, Rep.KosovoKuwaitKyrgyz RepublicLao PDRLate-demographic dividendLatin America & Caribbean Latin America & Caribbean (excluding high income)Latin America & the Caribbean (IDA & IBRD countries)LatviaLeast developed countries: UN classificationLebanonLesothoLiberiaLibyaLithuaniaLow & middle incomeLow incomeLower middle incomeLuxembourgMacao SAR, ChinaMacedonia, FYRMadagascarMalawiMalaysiaMaldivesMaliMaltaMauritaniaMauritiusMexicoMiddle East & North AfricaMiddle East & North Africa (excluding high income)Middle East & North Africa (IDA & IBRD countries)Middle incomeMoldovaMongoliaMontenegroMoroccoMozambiqueNamibiaNepalNetherlandsNew ZealandNicaraguaNigerNigeriaNorth AmericaNorwayOECD membersOmanOther small statesPacific island small statesPakistanPanamaPapua New GuineaParaguayPeruPhilippinesPolandPortugalPost-demographic dividendPre-demographic dividendQatarRomaniaRussian FederationRwandaSaudi ArabiaSenegalSerbiaSeychellesSierra LeoneSingaporeSlovak RepublicSloveniaSmall statesSolomon IslandsSouth AfricaSouth AsiaSouth Asia (IDA & IBRD)SpainSri LankaSt. Kitts and NevisSt. LuciaSt. Vincent and the GrenadinesSub-Saharan Africa Sub-Saharan Africa (excluding high income)Sub-Saharan Africa (IDA & IBRD countries)SudanSurinameSwazilandSwedenSwitzerlandSyrian Arab RepublicTajikistanTanzaniaThailandTimor-LesteTogoTongaTrinidad and TobagoTunisiaTurkeyTurkmenistanUgandaUkraineUnited KingdomUnited StatesUpper middle incomeUruguayVanuatuVenezuela, RBVietnamWest Bank and GazaWorldYemen, Rep.ZambiaZimbabwe Timeline:
This timeline shows a graph from 1980 to 2015 of Low & middle income. No data until 1979. Number of actual observations by date: 36.
Source name:
World Development Indicators
Source organization:
World Bank national accounts data files.
Categories, topics:
Economy & Growth, Environment
Last updated:
apr 23, 2017
Indicators value changes by year
Minimum:
21.998
jan 1, 1987
Maximum:
33.943
jan 1, 2015
At the date of observation
Value
Absolute change
Change from previous value
jan 1, 1980
24.026
+24.026
0.0%
jan 1, 1981
24.125
+0.098
0.41%
jan 1, 1982
23.25
-0.874
-3.62%
jan 1, 1983
22.952
-0.298
-1.28%
jan 1, 1984
22.798
-0.154
-0.67%
jan 1, 1985
23.21
+0.412
1.81%
jan 1, 1986
23.484
+0.273
1.18%
jan 1, 1987
21.998
-1.485
-6.32%
jan 1, 1988
23.565
+1.566
7.12%
jan 1, 1989
24.723
+1.158
4.91%
jan 1, 1990
25.916
+1.193
4.82%
jan 1, 1991
23.819
-2.097
-8.09%
jan 1, 1992
22.94
-0.879
-3.69%
jan 1, 1993
23.038
+0.098
0.43%
jan 1, 1994
23.757
+0.719
3.12%
jan 1, 1995
25.347
+1.591
6.7%
jan 1, 1996
25.09
-0.258
-1.02%
jan 1, 1997
24.408
-0.681
-2.72%
jan 1, 1998
24.197
-0.211
-0.87%
jan 1, 1999
23.468
-0.729
-3.01%
jan 1, 2000
24.65
+1.182
5.04%
jan 1, 2001
25.251
+0.601
2.44%
jan 1, 2002
25.141
-0.11
-0.44%
jan 1, 2003
26.373
+1.233
4.9%
jan 1, 2004
28.255
+1.882
7.13%
jan 1, 2005
29.929
+1.674
5.92%
jan 1, 2006
30.803
+0.875
2.92%
jan 1, 2007
32.726
+1.923
6.24%
jan 1, 2008
32.715
-0.011
-0.03%
jan 1, 2009
33.779
+1.064
3.25%
jan 1, 2010
32.54
-1.239
-3.67%
jan 1, 2011
33.423
+0.883
2.71%
jan 1, 2012
33.532
+0.109
0.33%
jan 1, 2013
33.763
+0.231
0.69%
jan 1, 2014
33.265
-0.498
-1.47%
jan 1, 2015
33.943
+0.678
2.04%
Ranking of countries by current statistics by years


Comments: