29
/
en
AIzaSyAYiBZKx7MnpbEhh9jyipgxe19OcubqV5w
April 1, 2024
62348
World
WLD
false
2
1
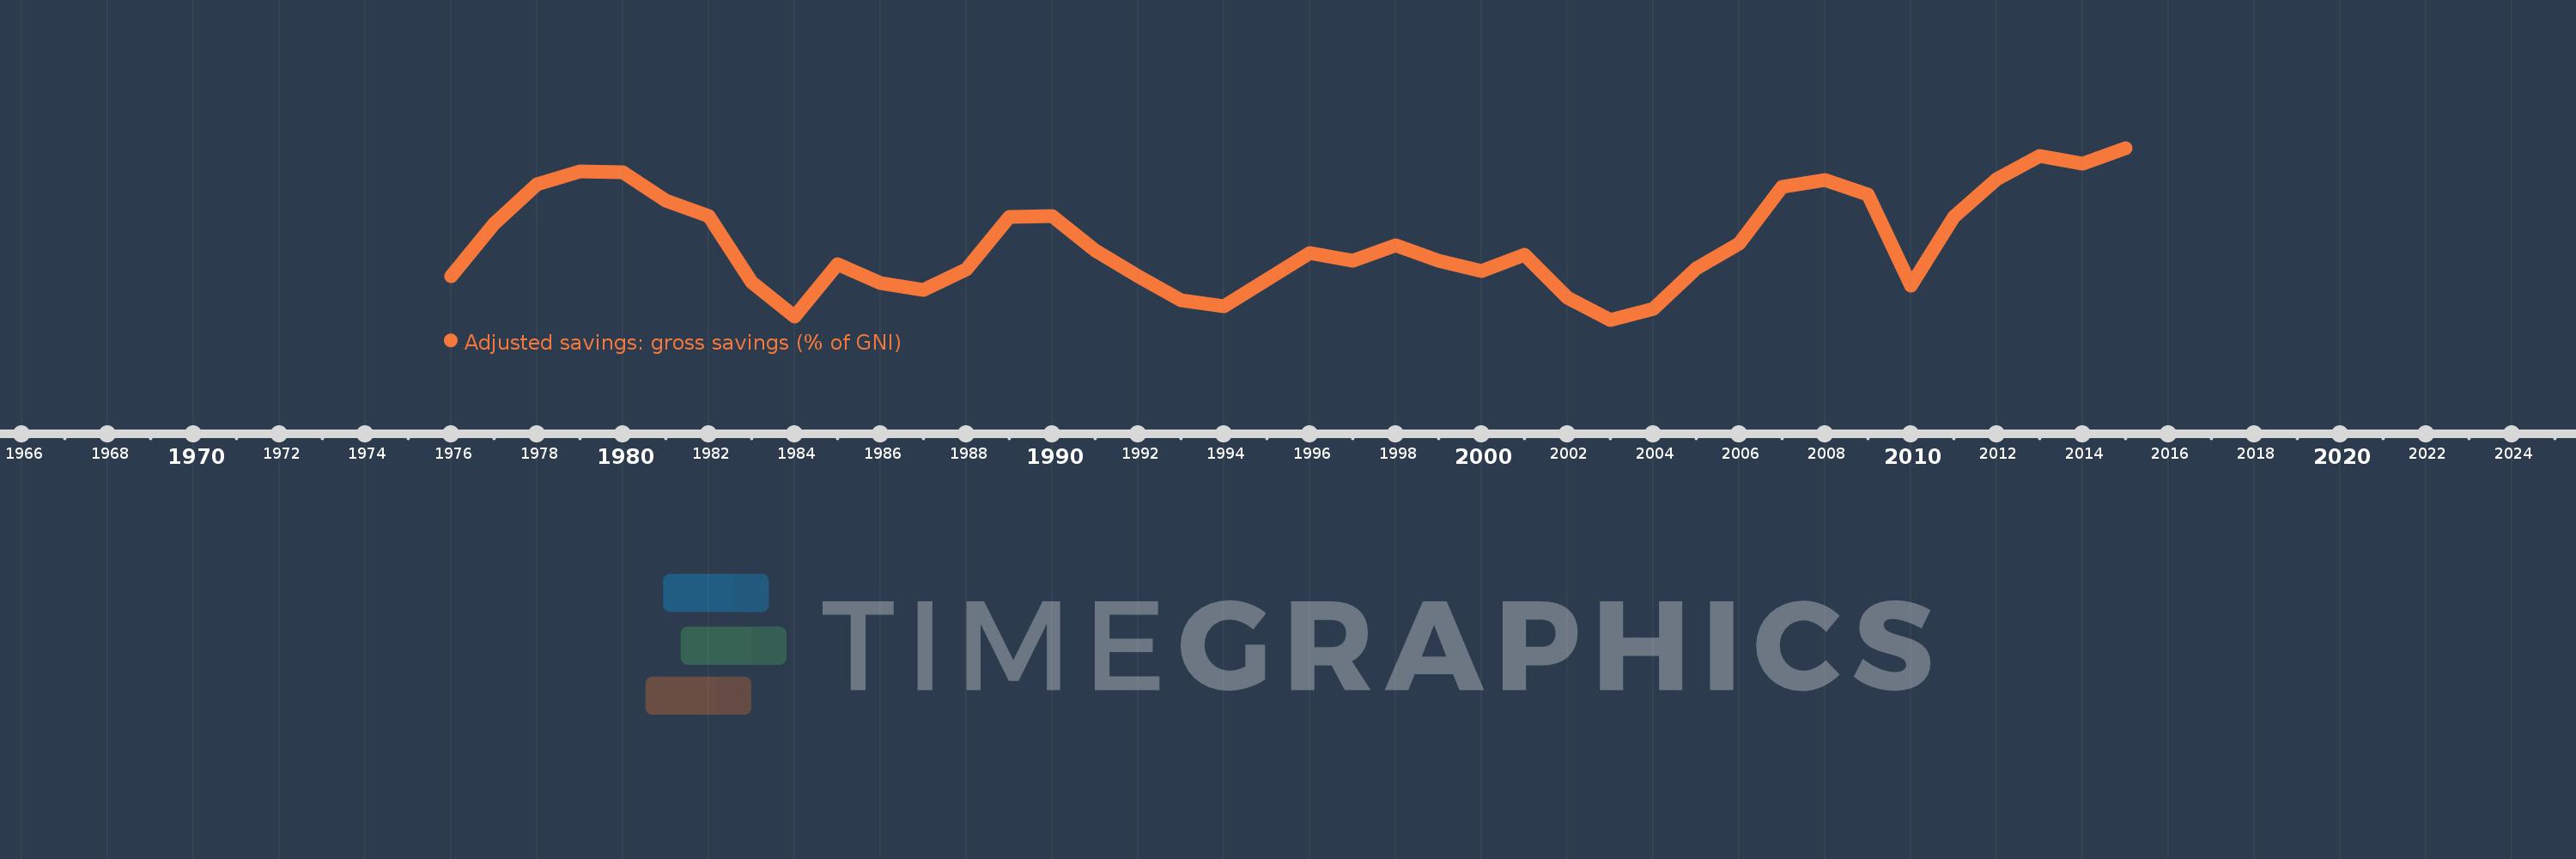
Adjusted savings: gross savings (% of GNI)
2015,2014,2013,2012,2011,2010,2009,2008,2007,2006,2005,2004,2003,2002,2001,2000,1999,1998,1997,1996,1995,1994,1993,1992,1991,1990,1989,1988,1987,1986,1985,1984,1983,1982,1981,1980,1979,1978,1977,1976
This statistics in other country:
AfghanistanAlbaniaAlgeriaAngolaAntigua and BarbudaArab WorldArgentinaArmeniaAustraliaAustriaAzerbaijanBahamas, TheBahrainBangladeshBarbadosBelarusBelgiumBelizeBeninBermudaBhutanBoliviaBosnia and HerzegovinaBotswanaBrazilBrunei DarussalamBulgariaBurkina FasoBurundiCabo VerdeCambodiaCameroonCanadaCaribbean small statesCentral African RepublicCentral Europe and the BalticsChadChileChinaColombiaComorosCongo, Dem. Rep.Congo, Rep.Costa RicaCote d'IvoireCroatiaCyprusCzech RepublicDenmarkDjiboutiDominicaDominican RepublicEarly-demographic dividendEast Asia & PacificEast Asia & Pacific (excluding high income)East Asia & Pacific (IDA & IBRD countries)EcuadorEgypt, Arab Rep.El SalvadorEquatorial GuineaEritreaEstoniaEthiopiaEuro areaEurope & Central AsiaEurope & Central Asia (excluding high income)Europe & Central Asia (IDA & IBRD countries)European UnionFaroe IslandsFijiFinlandFragile and conflict affected situationsFranceGabonGambia, TheGeorgiaGermanyGhanaGreeceGrenadaGuatemalaGuineaGuinea-BissauGuyanaHaitiHeavily indebted poor countries (HIPC)High incomeHondurasHong Kong SAR, ChinaHungaryIBRD onlyIcelandIDA & IBRD totalIDA blendIDA onlyIDA totalIndiaIndonesiaIran, Islamic Rep.IraqIrelandIsraelItalyJamaicaJapanJordanKazakhstanKenyaKiribatiKorea, Rep.KosovoKuwaitKyrgyz RepublicLao PDRLate-demographic dividendLatin America & Caribbean Latin America & Caribbean (excluding high income)Latin America & the Caribbean (IDA & IBRD countries)LatviaLeast developed countries: UN classificationLebanonLesothoLiberiaLibyaLithuaniaLow & middle incomeLow incomeLower middle incomeLuxembourgMacao SAR, ChinaMacedonia, FYRMadagascarMalawiMalaysiaMaldivesMaliMaltaMauritaniaMauritiusMexicoMiddle East & North AfricaMiddle East & North Africa (excluding high income)Middle East & North Africa (IDA & IBRD countries)Middle incomeMoldovaMongoliaMontenegroMoroccoMozambiqueNamibiaNepalNetherlandsNew ZealandNicaraguaNigerNigeriaNorth AmericaNorwayOECD membersOmanOther small statesPacific island small statesPakistanPanamaPapua New GuineaParaguayPeruPhilippinesPolandPortugalPost-demographic dividendPre-demographic dividendQatarRomaniaRussian FederationRwandaSaudi ArabiaSenegalSerbiaSeychellesSierra LeoneSingaporeSlovak RepublicSloveniaSmall statesSolomon IslandsSouth AfricaSouth AsiaSouth Asia (IDA & IBRD)SpainSri LankaSt. Kitts and NevisSt. LuciaSt. Vincent and the GrenadinesSub-Saharan Africa Sub-Saharan Africa (excluding high income)Sub-Saharan Africa (IDA & IBRD countries)SudanSurinameSwazilandSwedenSwitzerlandSyrian Arab RepublicTajikistanTanzaniaThailandTimor-LesteTogoTongaTrinidad and TobagoTunisiaTurkeyTurkmenistanUgandaUkraineUnited KingdomUnited StatesUpper middle incomeUruguayVanuatuVenezuela, RBVietnamWest Bank and GazaWorldYemen, Rep.ZambiaZimbabwe Timeline:
This timeline shows a graph from 1976 to 2015 of World. No data until 1975. Number of actual observations by date: 40.
Source name:
World Development Indicators
Source organization:
World Bank national accounts data files.
Categories, topics:
Economy & Growth, Environment
Last updated:
apr 23, 2017
Indicators value changes by year
Minimum:
22.218
jan 1, 2003
Maximum:
25.789
jan 1, 2015
At the date of observation
Value
Absolute change
Change from previous value
jan 1, 1976
23.117
+23.117
0.0%
jan 1, 1977
24.211
+1.094
4.73%
jan 1, 1978
25.03
+0.819
3.38%
jan 1, 1979
25.3
+0.27
1.08%
jan 1, 1980
25.275
-0.025
-0.1%
jan 1, 1981
24.694
-0.581
-2.3%
jan 1, 1982
24.369
-0.325
-1.32%
jan 1, 1983
22.994
-1.375
-5.64%
jan 1, 1984
22.291
-0.703
-3.06%
jan 1, 1985
23.381
+1.089
4.89%
jan 1, 1986
22.973
-0.408
-1.74%
jan 1, 1987
22.832
-0.141
-0.61%
jan 1, 1988
23.259
+0.427
1.87%
jan 1, 1989
24.354
+1.095
4.71%
jan 1, 1990
24.369
+0.015
0.06%
jan 1, 1991
23.651
-0.718
-2.95%
jan 1, 1992
23.127
-0.524
-2.21%
jan 1, 1993
22.629
-0.499
-2.16%
jan 1, 1994
22.49
-0.138
-0.61%
jan 1, 1995
23.058
+0.568
2.52%
jan 1, 1996
23.604
+0.546
2.37%
jan 1, 1997
23.439
-0.165
-0.7%
jan 1, 1998
23.759
+0.32
1.36%
jan 1, 1999
23.452
-0.307
-1.29%
jan 1, 2000
23.222
-0.231
-0.98%
jan 1, 2001
23.566
+0.344
1.48%
jan 1, 2002
22.671
-0.895
-3.8%
jan 1, 2003
22.218
-0.453
-2.0%
jan 1, 2004
22.443
+0.225
1.01%
jan 1, 2005
23.289
+0.846
3.77%
jan 1, 2006
23.81
+0.521
2.24%
jan 1, 2007
24.986
+1.176
4.94%
jan 1, 2008
25.117
+0.132
0.53%
jan 1, 2009
24.82
-0.297
-1.18%
jan 1, 2010
22.929
-1.891
-7.62%
jan 1, 2011
24.35
+1.42
6.2%
jan 1, 2012
25.133
+0.783
3.22%
jan 1, 2013
25.63
+0.497
1.98%
jan 1, 2014
25.469
-0.161
-0.63%
jan 1, 2015
25.789
+0.32
1.26%
Ranking of countries by current statistics by years


Comments: