29
/
en
AIzaSyAYiBZKx7MnpbEhh9jyipgxe19OcubqV5w
April 1, 2024
55293
Pre-demographic dividend
PRE
false
2
1
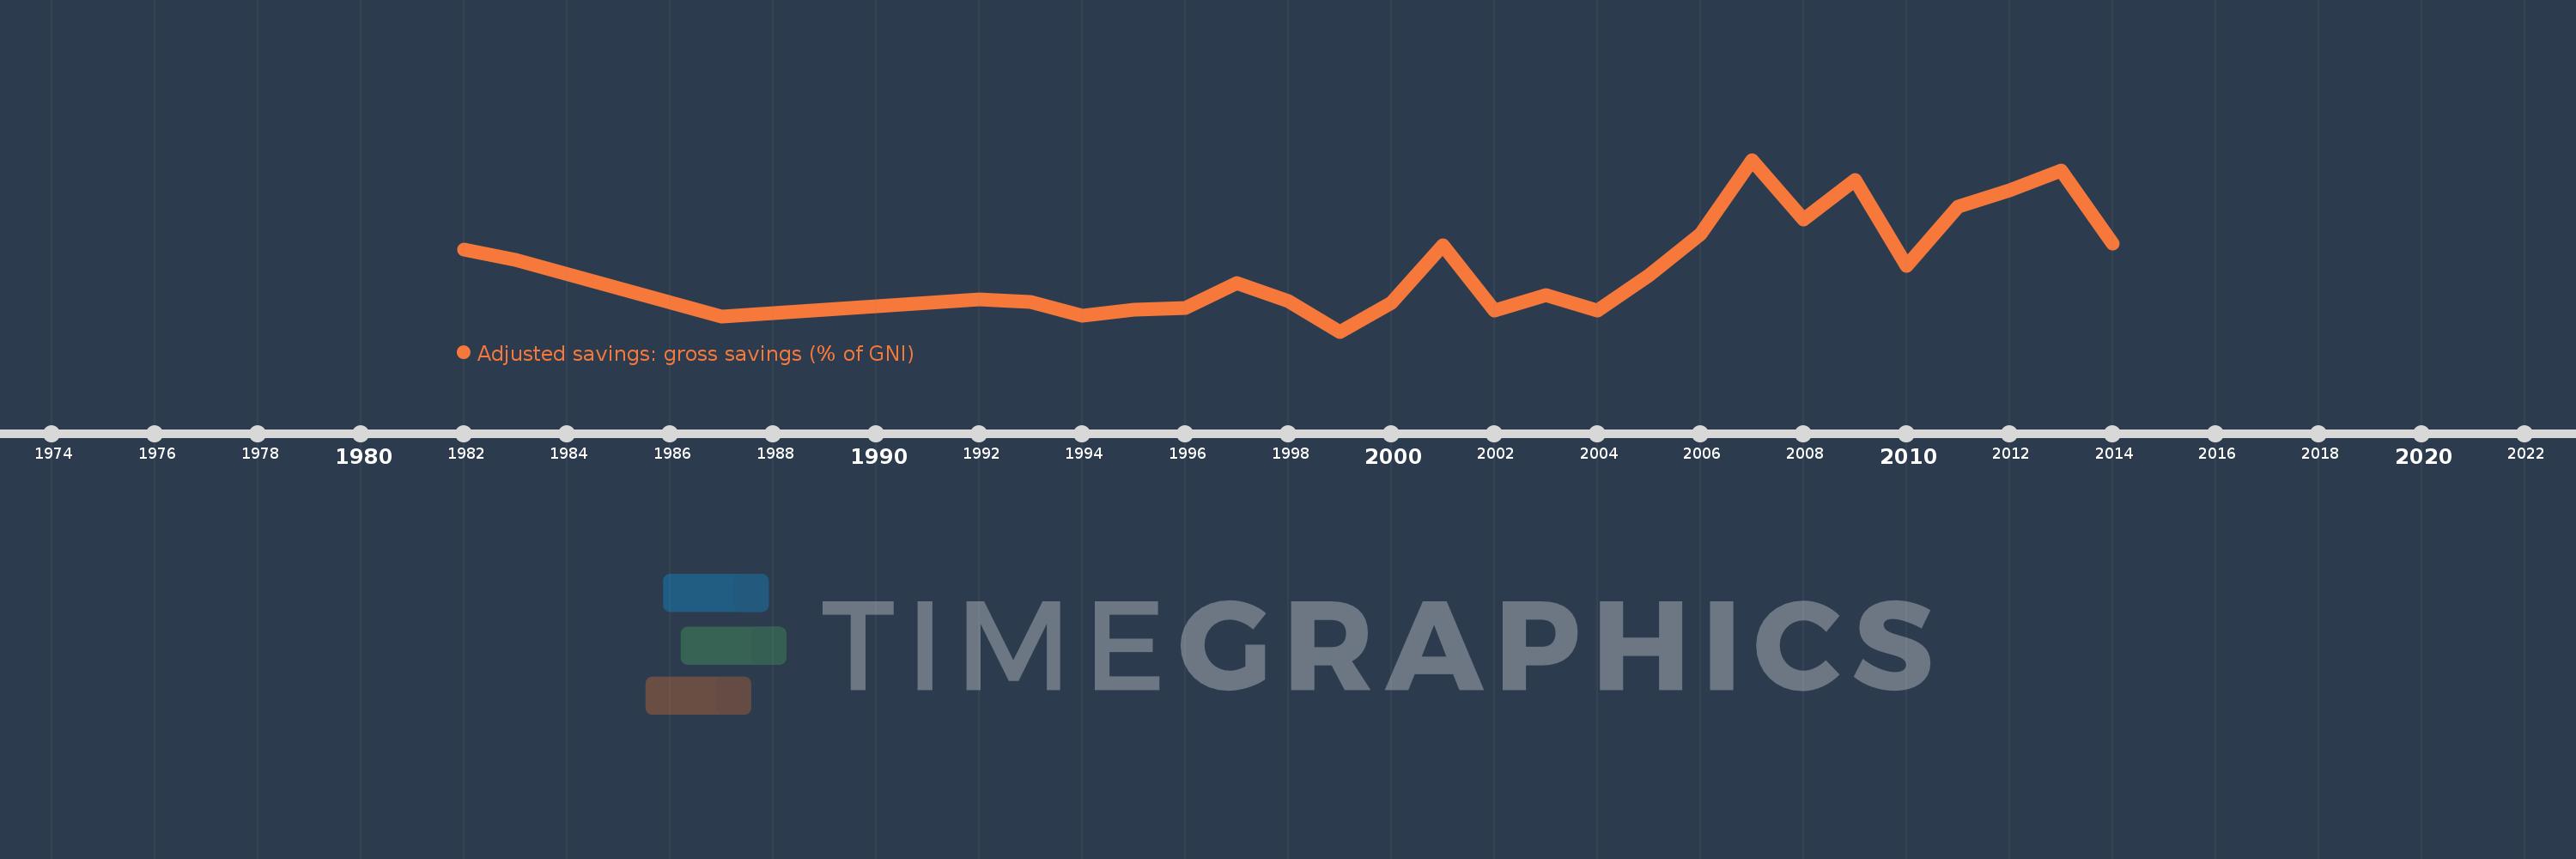
Adjusted savings: gross savings (% of GNI)
2014,2013,2012,2011,2010,2009,2008,2007,2006,2005,2004,2003,2002,2001,2000,1999,1998,1997,1996,1995,1994,1993,1992,1987,1983,1982
This statistics in other country:
AfghanistanAlbaniaAlgeriaAngolaAntigua and BarbudaArab WorldArgentinaArmeniaAustraliaAustriaAzerbaijanBahamas, TheBahrainBangladeshBarbadosBelarusBelgiumBelizeBeninBermudaBhutanBoliviaBosnia and HerzegovinaBotswanaBrazilBrunei DarussalamBulgariaBurkina FasoBurundiCabo VerdeCambodiaCameroonCanadaCaribbean small statesCentral African RepublicCentral Europe and the BalticsChadChileChinaColombiaComorosCongo, Dem. Rep.Congo, Rep.Costa RicaCote d'IvoireCroatiaCyprusCzech RepublicDenmarkDjiboutiDominicaDominican RepublicEarly-demographic dividendEast Asia & PacificEast Asia & Pacific (excluding high income)East Asia & Pacific (IDA & IBRD countries)EcuadorEgypt, Arab Rep.El SalvadorEquatorial GuineaEritreaEstoniaEthiopiaEuro areaEurope & Central AsiaEurope & Central Asia (excluding high income)Europe & Central Asia (IDA & IBRD countries)European UnionFaroe IslandsFijiFinlandFragile and conflict affected situationsFranceGabonGambia, TheGeorgiaGermanyGhanaGreeceGrenadaGuatemalaGuineaGuinea-BissauGuyanaHaitiHeavily indebted poor countries (HIPC)High incomeHondurasHong Kong SAR, ChinaHungaryIBRD onlyIcelandIDA & IBRD totalIDA blendIDA onlyIDA totalIndiaIndonesiaIran, Islamic Rep.IraqIrelandIsraelItalyJamaicaJapanJordanKazakhstanKenyaKiribatiKorea, Rep.KosovoKuwaitKyrgyz RepublicLao PDRLate-demographic dividendLatin America & Caribbean Latin America & Caribbean (excluding high income)Latin America & the Caribbean (IDA & IBRD countries)LatviaLeast developed countries: UN classificationLebanonLesothoLiberiaLibyaLithuaniaLow & middle incomeLow incomeLower middle incomeLuxembourgMacao SAR, ChinaMacedonia, FYRMadagascarMalawiMalaysiaMaldivesMaliMaltaMauritaniaMauritiusMexicoMiddle East & North AfricaMiddle East & North Africa (excluding high income)Middle East & North Africa (IDA & IBRD countries)Middle incomeMoldovaMongoliaMontenegroMoroccoMozambiqueNamibiaNepalNetherlandsNew ZealandNicaraguaNigerNigeriaNorth AmericaNorwayOECD membersOmanOther small statesPacific island small statesPakistanPanamaPapua New GuineaParaguayPeruPhilippinesPolandPortugalPost-demographic dividendPre-demographic dividendQatarRomaniaRussian FederationRwandaSaudi ArabiaSenegalSerbiaSeychellesSierra LeoneSingaporeSlovak RepublicSloveniaSmall statesSolomon IslandsSouth AfricaSouth AsiaSouth Asia (IDA & IBRD)SpainSri LankaSt. Kitts and NevisSt. LuciaSt. Vincent and the GrenadinesSub-Saharan Africa Sub-Saharan Africa (excluding high income)Sub-Saharan Africa (IDA & IBRD countries)SudanSurinameSwazilandSwedenSwitzerlandSyrian Arab RepublicTajikistanTanzaniaThailandTimor-LesteTogoTongaTrinidad and TobagoTunisiaTurkeyTurkmenistanUgandaUkraineUnited KingdomUnited StatesUpper middle incomeUruguayVanuatuVenezuela, RBVietnamWest Bank and GazaWorldYemen, Rep.ZambiaZimbabwe Timeline:
This timeline shows a graph from 1982 to 2014 of Pre-demographic dividend. No data until 1981. Number of actual observations by date: 26.
Source name:
World Development Indicators
Source organization:
World Bank national accounts data files.
Categories, topics:
Economy & Growth, Environment
Last updated:
apr 23, 2017
Indicators value changes by year
At the date of observation
Value
Absolute change
Change from previous value
jan 1, 1982
18.482
+18.482
0.0%
jan 1, 1983
17.349
-1.133
-6.13%
jan 1, 1987
10.922
-6.427
-37.04%
jan 1, 1992
12.847
+1.925
17.63%
jan 1, 1993
12.591
-0.256
-2.0%
jan 1, 1994
11.009
-1.582
-12.57%
jan 1, 1995
11.656
+0.648
5.88%
jan 1, 1996
11.864
+0.207
1.78%
jan 1, 1997
14.755
+2.891
24.37%
jan 1, 1998
12.655
-2.1
-14.23%
jan 1, 1999
9.221
-3.434
-27.14%
jan 1, 2000
12.431
+3.21
34.81%
jan 1, 2001
19.029
+6.598
53.08%
jan 1, 2002
11.631
-7.398
-38.88%
jan 1, 2003
13.348
+1.717
14.77%
jan 1, 2004
11.634
-1.715
-12.85%
jan 1, 2005
15.635
+4.001
34.4%
jan 1, 2006
20.296
+4.661
29.81%
jan 1, 2007
28.66
+8.365
41.21%
jan 1, 2008
21.887
-6.774
-23.63%
jan 1, 2009
26.417
+4.53
20.7%
jan 1, 2010
16.684
-9.733
-36.84%
jan 1, 2011
23.375
+6.691
40.1%
jan 1, 2012
25.176
+1.801
7.7%
jan 1, 2013
27.4
+2.224
8.83%
jan 1, 2014
19.192
-8.208
-29.95%
Ranking of countries by current statistics by years


Comments: