29
/
en
AIzaSyAYiBZKx7MnpbEhh9jyipgxe19OcubqV5w
April 1, 2024
67387
Angola
AGO
true
2
1
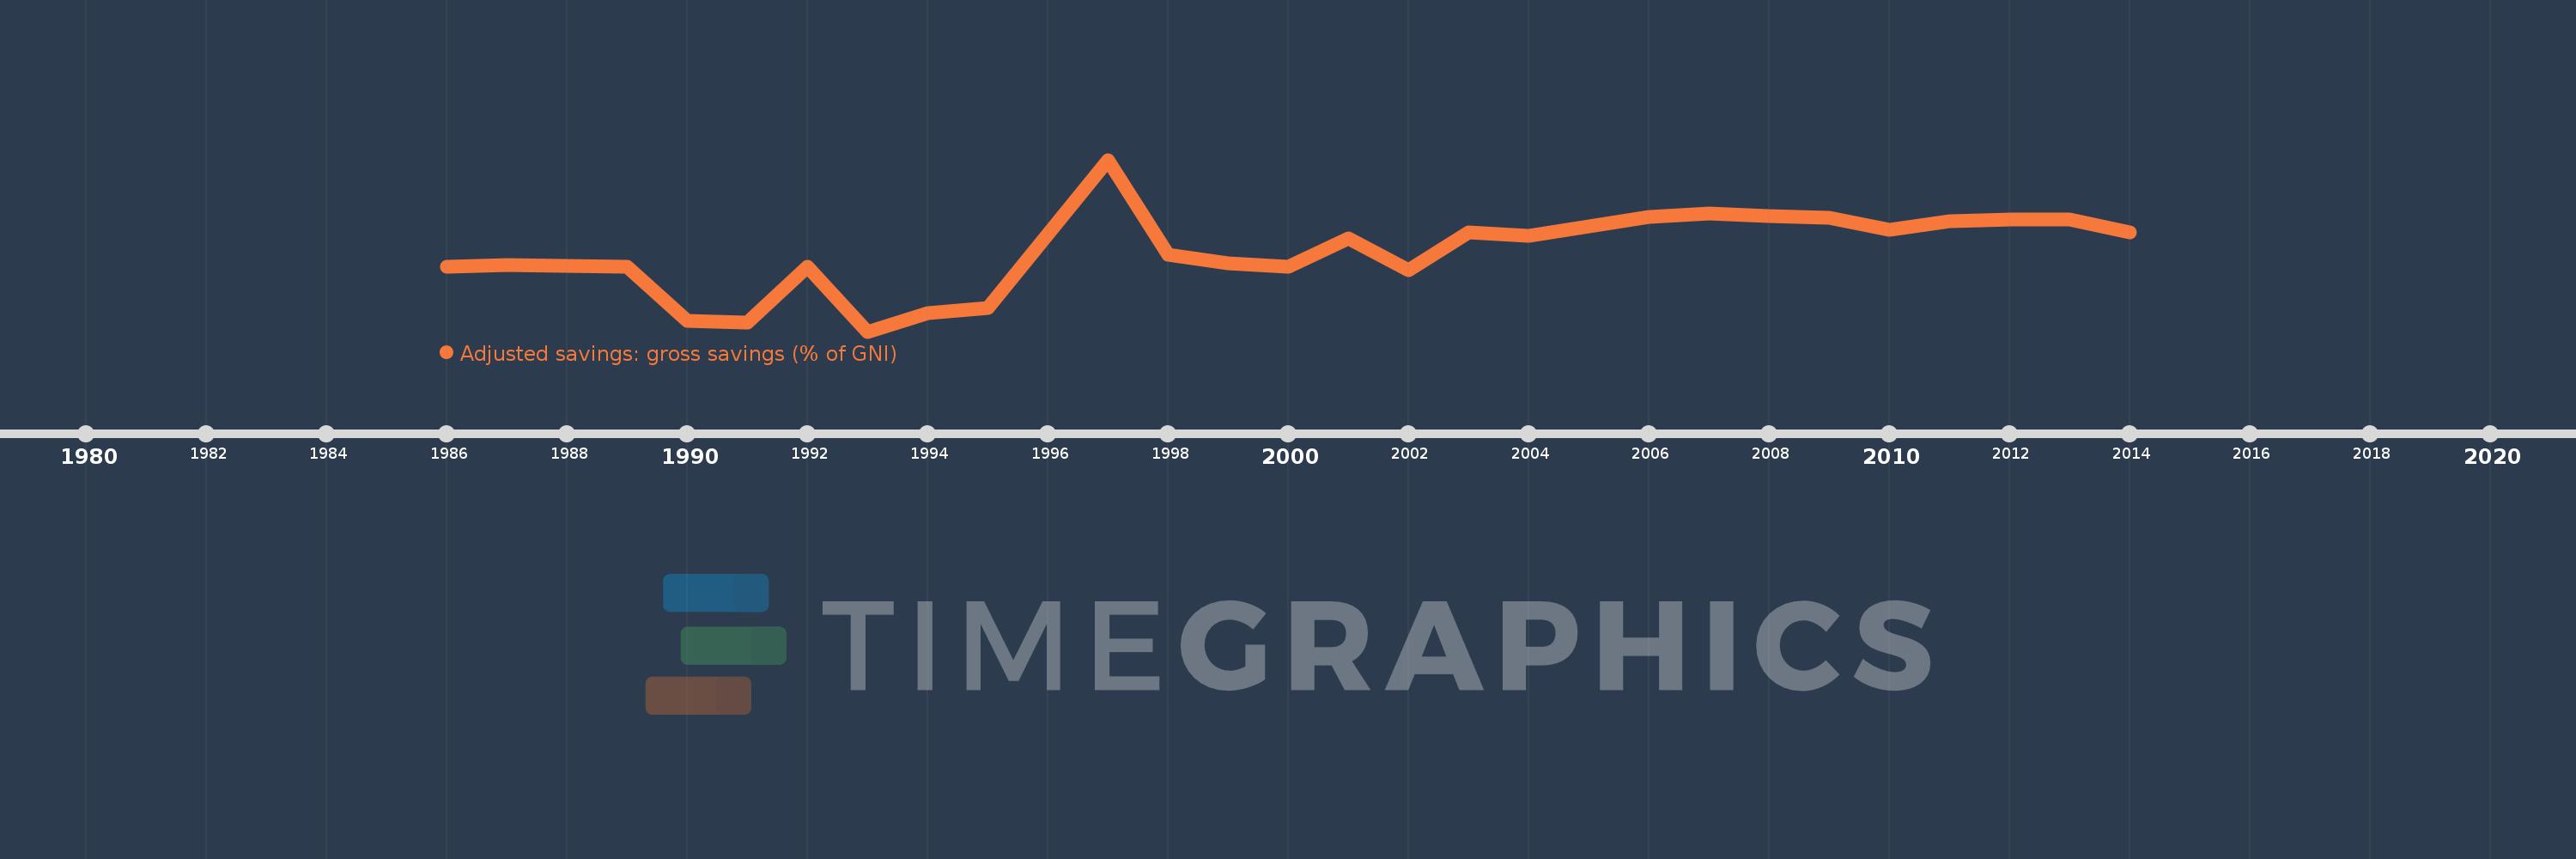
Adjusted savings: gross savings (% of GNI)
2014,2013,2012,2011,2010,2009,2008,2007,2006,2005,2004,2003,2002,2001,2000,1999,1998,1997,1995,1994,1993,1992,1991,1990,1989,1988,1987,1986
This statistics in other country:
AfghanistanAlbaniaAlgeriaAngolaAntigua and BarbudaArab WorldArgentinaArmeniaAustraliaAustriaAzerbaijanBahamas, TheBahrainBangladeshBarbadosBelarusBelgiumBelizeBeninBermudaBhutanBoliviaBosnia and HerzegovinaBotswanaBrazilBrunei DarussalamBulgariaBurkina FasoBurundiCabo VerdeCambodiaCameroonCanadaCaribbean small statesCentral African RepublicCentral Europe and the BalticsChadChileChinaColombiaComorosCongo, Dem. Rep.Congo, Rep.Costa RicaCote d'IvoireCroatiaCyprusCzech RepublicDenmarkDjiboutiDominicaDominican RepublicEarly-demographic dividendEast Asia & PacificEast Asia & Pacific (excluding high income)East Asia & Pacific (IDA & IBRD countries)EcuadorEgypt, Arab Rep.El SalvadorEquatorial GuineaEritreaEstoniaEthiopiaEuro areaEurope & Central AsiaEurope & Central Asia (excluding high income)Europe & Central Asia (IDA & IBRD countries)European UnionFaroe IslandsFijiFinlandFragile and conflict affected situationsFranceGabonGambia, TheGeorgiaGermanyGhanaGreeceGrenadaGuatemalaGuineaGuinea-BissauGuyanaHaitiHeavily indebted poor countries (HIPC)High incomeHondurasHong Kong SAR, ChinaHungaryIBRD onlyIcelandIDA & IBRD totalIDA blendIDA onlyIDA totalIndiaIndonesiaIran, Islamic Rep.IraqIrelandIsraelItalyJamaicaJapanJordanKazakhstanKenyaKiribatiKorea, Rep.KosovoKuwaitKyrgyz RepublicLao PDRLate-demographic dividendLatin America & Caribbean Latin America & Caribbean (excluding high income)Latin America & the Caribbean (IDA & IBRD countries)LatviaLeast developed countries: UN classificationLebanonLesothoLiberiaLibyaLithuaniaLow & middle incomeLow incomeLower middle incomeLuxembourgMacao SAR, ChinaMacedonia, FYRMadagascarMalawiMalaysiaMaldivesMaliMaltaMauritaniaMauritiusMexicoMiddle East & North AfricaMiddle East & North Africa (excluding high income)Middle East & North Africa (IDA & IBRD countries)Middle incomeMoldovaMongoliaMontenegroMoroccoMozambiqueNamibiaNepalNetherlandsNew ZealandNicaraguaNigerNigeriaNorth AmericaNorwayOECD membersOmanOther small statesPacific island small statesPakistanPanamaPapua New GuineaParaguayPeruPhilippinesPolandPortugalPost-demographic dividendPre-demographic dividendQatarRomaniaRussian FederationRwandaSaudi ArabiaSenegalSerbiaSeychellesSierra LeoneSingaporeSlovak RepublicSloveniaSmall statesSolomon IslandsSouth AfricaSouth AsiaSouth Asia (IDA & IBRD)SpainSri LankaSt. Kitts and NevisSt. LuciaSt. Vincent and the GrenadinesSub-Saharan Africa Sub-Saharan Africa (excluding high income)Sub-Saharan Africa (IDA & IBRD countries)SudanSurinameSwazilandSwedenSwitzerlandSyrian Arab RepublicTajikistanTanzaniaThailandTimor-LesteTogoTongaTrinidad and TobagoTunisiaTurkeyTurkmenistanUgandaUkraineUnited KingdomUnited StatesUpper middle incomeUruguayVanuatuVenezuela, RBVietnamWest Bank and GazaWorldYemen, Rep.ZambiaZimbabwe Timeline:
This timeline shows a graph from 1986 to 2014 of Angola. No data until 1985. Number of actual observations by date: 28.
Source name:
World Development Indicators
Source organization:
World Bank national accounts data files.
Categories, topics:
Economy & Growth, Environment
Last updated:
apr 23, 2017
Indicators value changes by year
Minimum:
-59.576
jan 1, 1993
Maximum:
98.956
jan 1, 1997
At the date of observation
Value
Absolute change
Change from previous value
jan 1, 1986
0.314
+0.314
0.0%
jan 1, 1987
2.109
+1.795
571.43%
jan 1, 1988
0.778
-1.331
-63.12%
jan 1, 1989
0.479
-0.299
-38.46%
jan 1, 1990
-50.06
-50.539
-10.56K%
jan 1, 1991
-51.153
-1.094
2.18%
jan 1, 1992
0.266
+51.419
-100.52%
jan 1, 1993
-59.576
-59.842
-22.5K%
jan 1, 1994
-42.152
+17.425
-29.25%
jan 1, 1995
-37.851
+4.3
-10.2%
jan 1, 1997
98.956
+136.807
-361.43%
jan 1, 1998
11.562
-87.394
-88.32%
jan 1, 1999
3.378
-8.184
-70.78%
jan 1, 2000
0.072
-3.306
-97.85%
jan 1, 2001
26.285
+26.212
36.18K%
jan 1, 2002
-3.104
-29.389
-111.81%
jan 1, 2003
32.335
+35.439
-1.14K%
jan 1, 2004
28.852
-3.483
-10.77%
jan 1, 2005
37.498
+8.646
29.97%
jan 1, 2006
46.228
+8.73
23.28%
jan 1, 2007
49.265
+3.037
6.57%
jan 1, 2008
46.967
-2.297
-4.66%
jan 1, 2009
45.746
-1.221
-2.6%
jan 1, 2010
34.46
-11.287
-24.67%
jan 1, 2011
41.906
+7.446
21.61%
jan 1, 2012
43.546
+1.64
3.91%
jan 1, 2013
43.949
+0.403
0.93%
jan 1, 2014
31.769
-12.18
-27.71%
Ranking of countries by current statistics by years


Comments: