29
/
en
AIzaSyAYiBZKx7MnpbEhh9jyipgxe19OcubqV5w
April 1, 2024
93196
Bulgaria
BGR
true
2
1
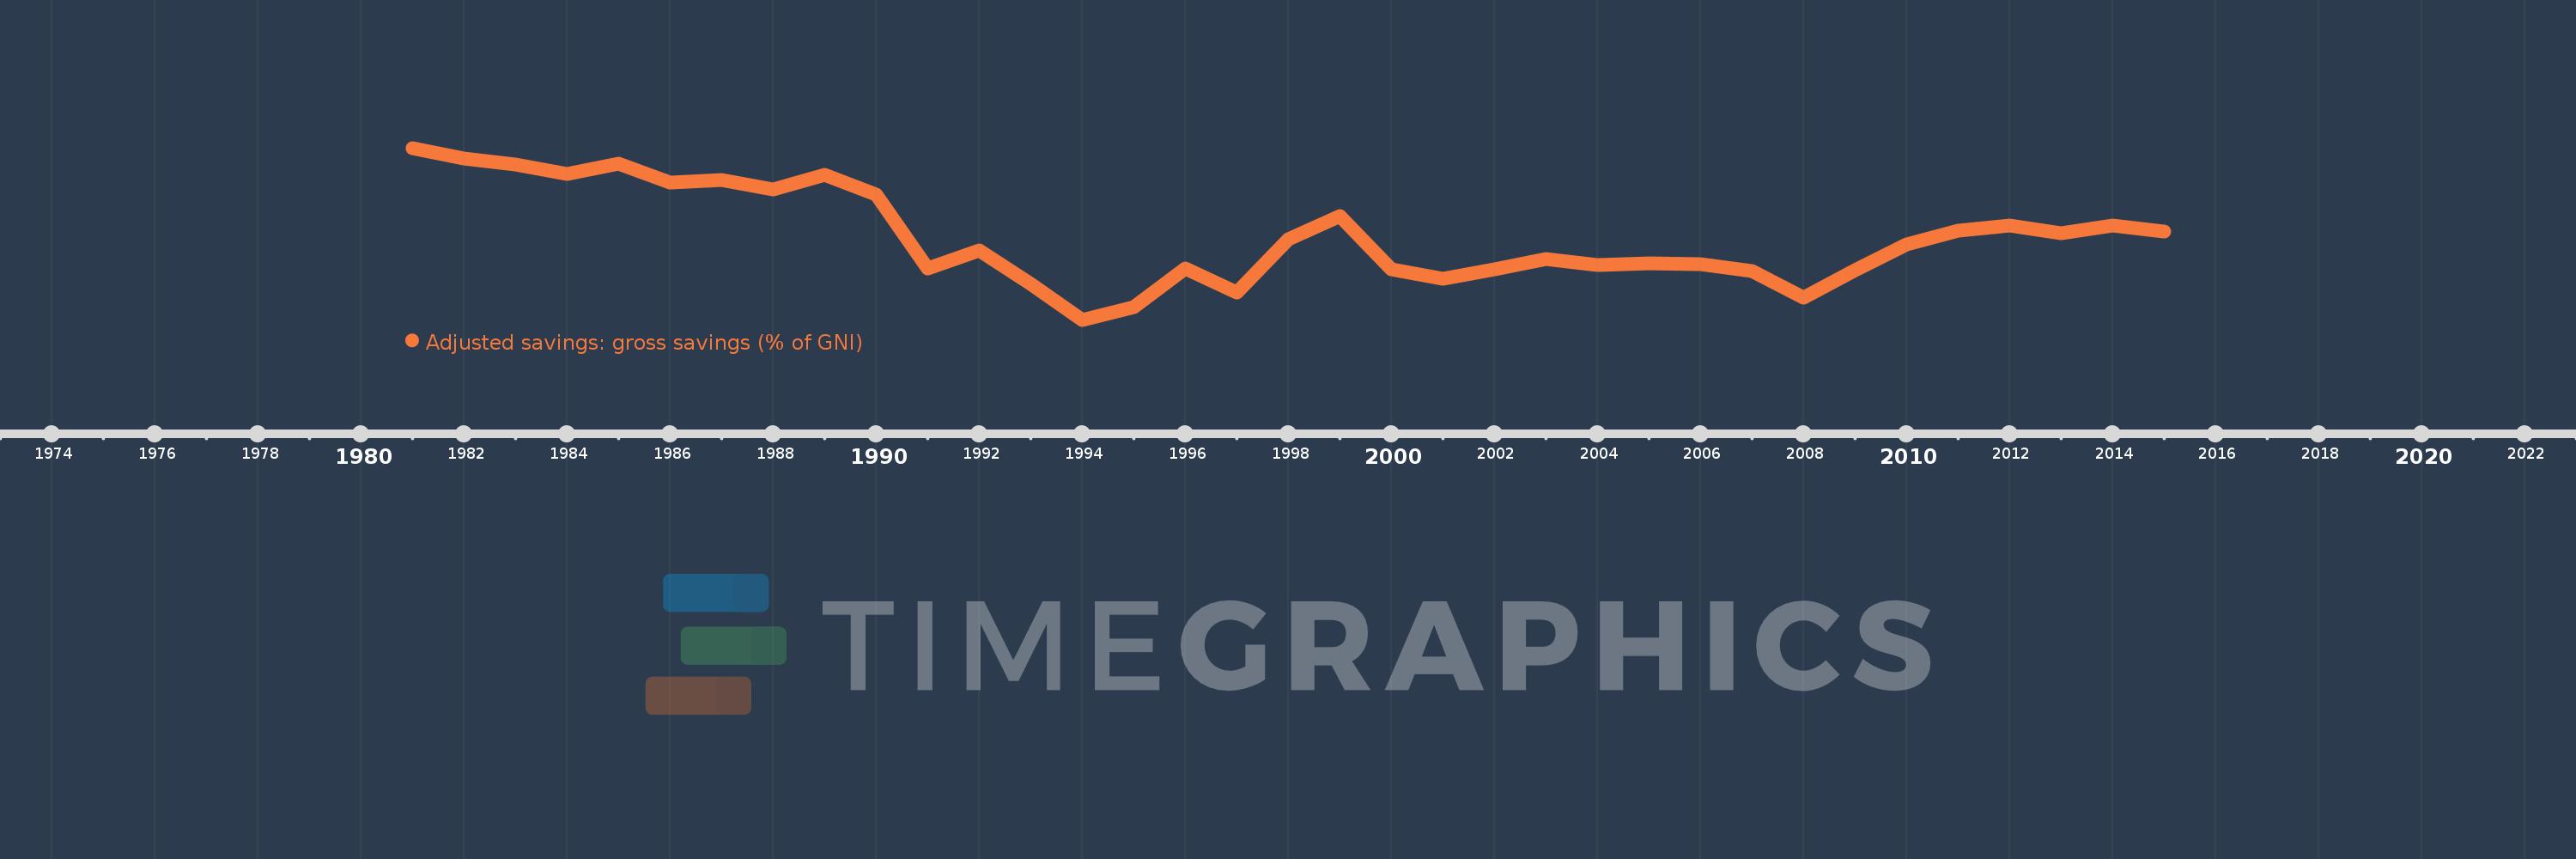
Adjusted savings: gross savings (% of GNI)
2015,2014,2013,2012,2011,2010,2009,2008,2007,2006,2005,2004,2003,2002,2001,2000,1999,1998,1997,1996,1995,1994,1993,1992,1991,1990,1989,1988,1987,1986,1985,1984,1983,1982,1981
This statistics in other country:
AfghanistanAlbaniaAlgeriaAngolaAntigua and BarbudaArab WorldArgentinaArmeniaAustraliaAustriaAzerbaijanBahamas, TheBahrainBangladeshBarbadosBelarusBelgiumBelizeBeninBermudaBhutanBoliviaBosnia and HerzegovinaBotswanaBrazilBrunei DarussalamBulgariaBurkina FasoBurundiCabo VerdeCambodiaCameroonCanadaCaribbean small statesCentral African RepublicCentral Europe and the BalticsChadChileChinaColombiaComorosCongo, Dem. Rep.Congo, Rep.Costa RicaCote d'IvoireCroatiaCyprusCzech RepublicDenmarkDjiboutiDominicaDominican RepublicEarly-demographic dividendEast Asia & PacificEast Asia & Pacific (excluding high income)East Asia & Pacific (IDA & IBRD countries)EcuadorEgypt, Arab Rep.El SalvadorEquatorial GuineaEritreaEstoniaEthiopiaEuro areaEurope & Central AsiaEurope & Central Asia (excluding high income)Europe & Central Asia (IDA & IBRD countries)European UnionFaroe IslandsFijiFinlandFragile and conflict affected situationsFranceGabonGambia, TheGeorgiaGermanyGhanaGreeceGrenadaGuatemalaGuineaGuinea-BissauGuyanaHaitiHeavily indebted poor countries (HIPC)High incomeHondurasHong Kong SAR, ChinaHungaryIBRD onlyIcelandIDA & IBRD totalIDA blendIDA onlyIDA totalIndiaIndonesiaIran, Islamic Rep.IraqIrelandIsraelItalyJamaicaJapanJordanKazakhstanKenyaKiribatiKorea, Rep.KosovoKuwaitKyrgyz RepublicLao PDRLate-demographic dividendLatin America & Caribbean Latin America & Caribbean (excluding high income)Latin America & the Caribbean (IDA & IBRD countries)LatviaLeast developed countries: UN classificationLebanonLesothoLiberiaLibyaLithuaniaLow & middle incomeLow incomeLower middle incomeLuxembourgMacao SAR, ChinaMacedonia, FYRMadagascarMalawiMalaysiaMaldivesMaliMaltaMauritaniaMauritiusMexicoMiddle East & North AfricaMiddle East & North Africa (excluding high income)Middle East & North Africa (IDA & IBRD countries)Middle incomeMoldovaMongoliaMontenegroMoroccoMozambiqueNamibiaNepalNetherlandsNew ZealandNicaraguaNigerNigeriaNorth AmericaNorwayOECD membersOmanOther small statesPacific island small statesPakistanPanamaPapua New GuineaParaguayPeruPhilippinesPolandPortugalPost-demographic dividendPre-demographic dividendQatarRomaniaRussian FederationRwandaSaudi ArabiaSenegalSerbiaSeychellesSierra LeoneSingaporeSlovak RepublicSloveniaSmall statesSolomon IslandsSouth AfricaSouth AsiaSouth Asia (IDA & IBRD)SpainSri LankaSt. Kitts and NevisSt. LuciaSt. Vincent and the GrenadinesSub-Saharan Africa Sub-Saharan Africa (excluding high income)Sub-Saharan Africa (IDA & IBRD countries)SudanSurinameSwazilandSwedenSwitzerlandSyrian Arab RepublicTajikistanTanzaniaThailandTimor-LesteTogoTongaTrinidad and TobagoTunisiaTurkeyTurkmenistanUgandaUkraineUnited KingdomUnited StatesUpper middle incomeUruguayVanuatuVenezuela, RBVietnamWest Bank and GazaWorldYemen, Rep.ZambiaZimbabwe Timeline:
This timeline shows a graph from 1981 to 2015 of Bulgaria. No data until 1980. Number of actual observations by date: 35.
Source name:
World Development Indicators
Source organization:
World Bank national accounts data files.
Categories, topics:
Economy & Growth, Environment
Last updated:
apr 23, 2017
Indicators value changes by year
Maximum:
38.329
jan 1, 1981
At the date of observation
Value
Absolute change
Change from previous value
jan 1, 1981
38.329
+38.329
0.0%
jan 1, 1982
36.42
-1.909
-4.98%
jan 1, 1983
35.193
-1.226
-3.37%
jan 1, 1984
33.423
-1.77
-5.03%
jan 1, 1985
35.412
+1.989
5.95%
jan 1, 1986
31.957
-3.455
-9.76%
jan 1, 1987
32.331
+0.375
1.17%
jan 1, 1988
30.672
-1.66
-5.13%
jan 1, 1989
33.29
+2.618
8.54%
jan 1, 1990
29.689
-3.6
-10.82%
jan 1, 1991
15.915
-13.774
-46.39%
jan 1, 1992
19.312
+3.397
21.34%
jan 1, 1993
13.051
-6.261
-32.42%
jan 1, 1994
6.328
-6.723
-51.51%
jan 1, 1995
8.673
+2.345
37.05%
jan 1, 1996
15.945
+7.272
83.85%
jan 1, 1997
11.448
-4.497
-28.2%
jan 1, 1998
21.3
+9.852
86.06%
jan 1, 1999
25.65
+4.349
20.42%
jan 1, 2000
15.78
-9.87
-38.48%
jan 1, 2001
13.937
-1.843
-11.68%
jan 1, 2002
15.719
+1.782
12.78%
jan 1, 2003
17.638
+1.919
12.21%
jan 1, 2004
16.597
-1.042
-5.9%
jan 1, 2005
16.812
+0.215
1.3%
jan 1, 2006
16.715
-0.096
-0.57%
jan 1, 2007
15.382
-1.334
-7.98%
jan 1, 2008
10.402
-4.98
-32.38%
jan 1, 2009
15.591
+5.19
49.89%
jan 1, 2010
20.326
+4.734
30.36%
jan 1, 2011
22.951
+2.626
12.92%
jan 1, 2012
23.836
+0.885
3.85%
jan 1, 2013
22.494
-1.341
-5.63%
jan 1, 2014
23.82
+1.326
5.89%
jan 1, 2015
22.743
-1.077
-4.52%
Ranking of countries by current statistics by years


Comments: