29
/
en
AIzaSyAYiBZKx7MnpbEhh9jyipgxe19OcubqV5w
April 1, 2024
111824
Costa Rica
CRI
true
2
1
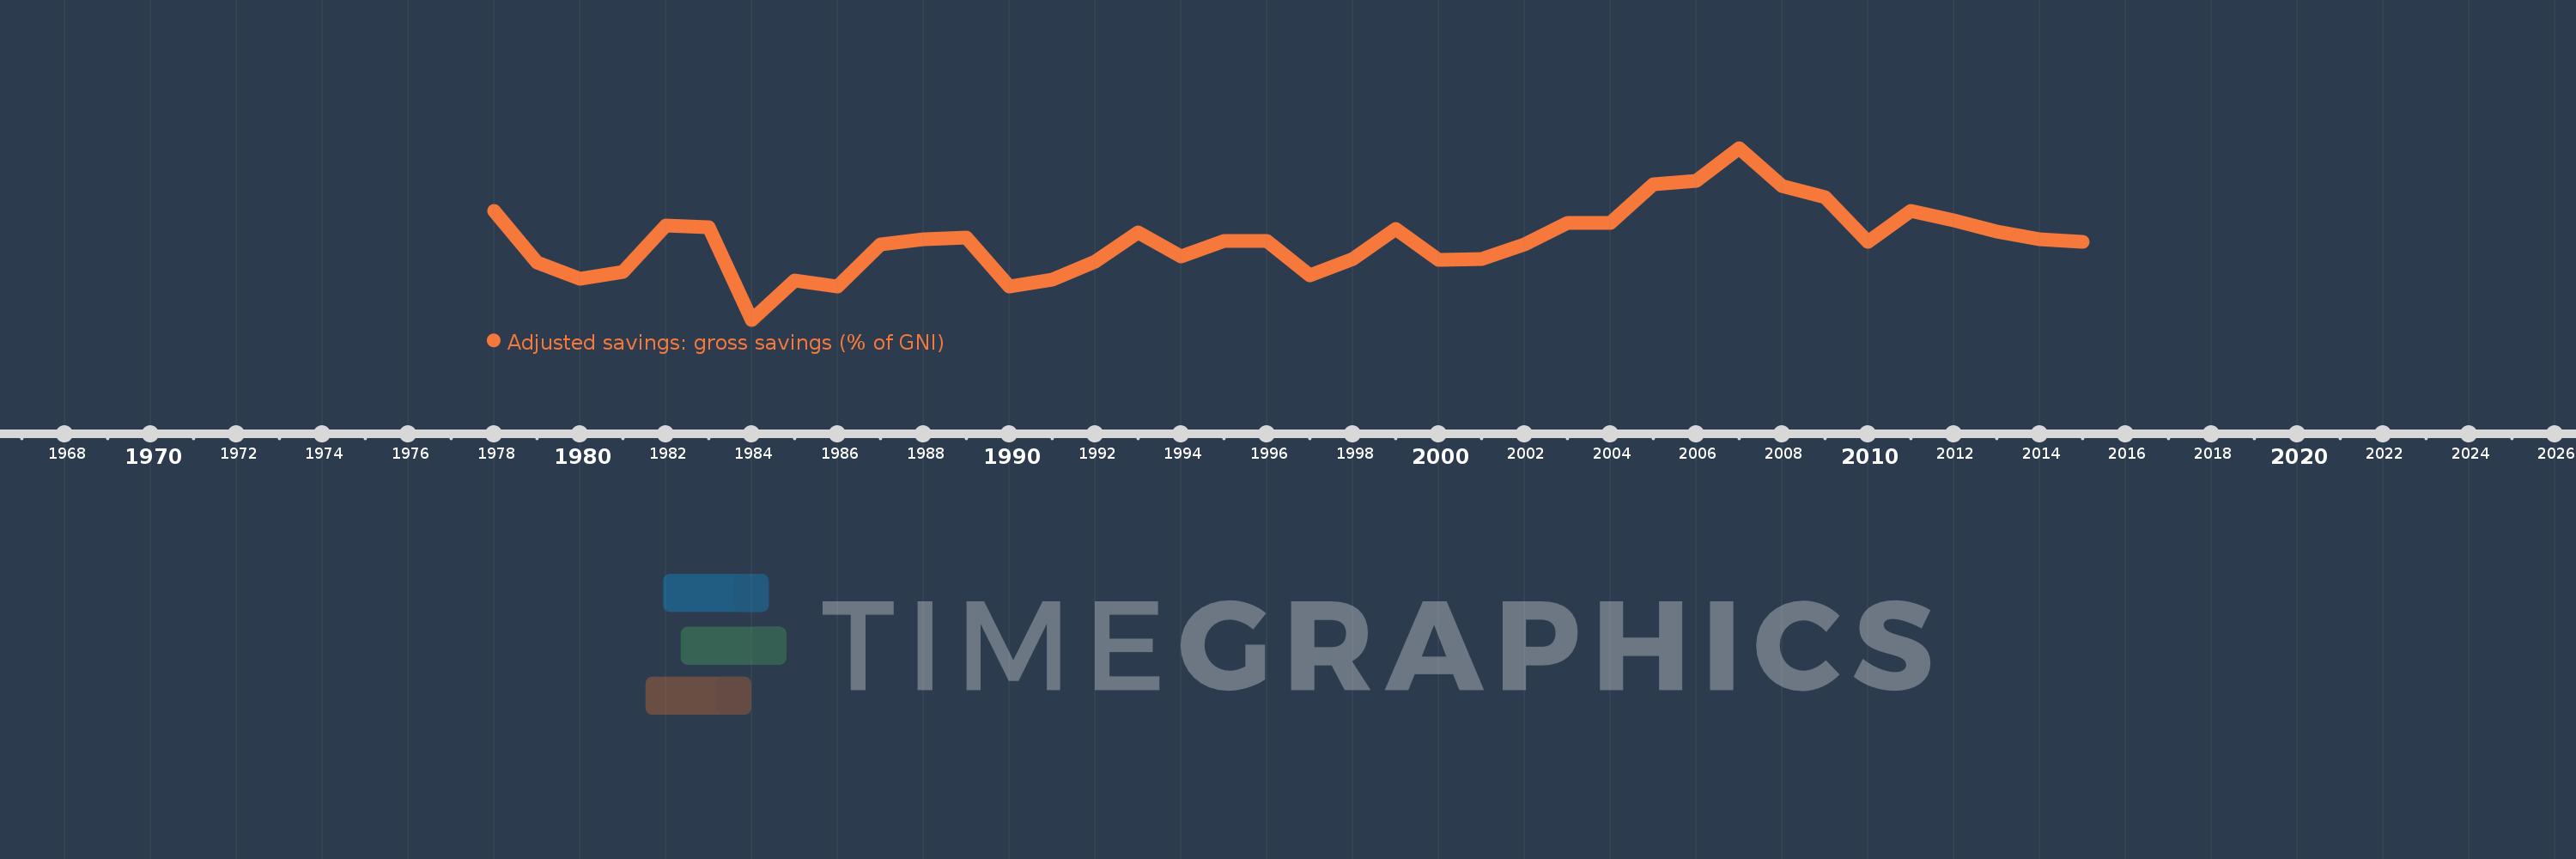
Adjusted savings: gross savings (% of GNI)
2015,2014,2013,2012,2011,2010,2009,2008,2007,2006,2005,2004,2003,2002,2001,2000,1999,1998,1997,1996,1995,1994,1993,1992,1991,1990,1989,1988,1987,1986,1985,1984,1983,1982,1981,1980,1979,1978
This statistics in other country:
AfghanistanAlbaniaAlgeriaAngolaAntigua and BarbudaArab WorldArgentinaArmeniaAustraliaAustriaAzerbaijanBahamas, TheBahrainBangladeshBarbadosBelarusBelgiumBelizeBeninBermudaBhutanBoliviaBosnia and HerzegovinaBotswanaBrazilBrunei DarussalamBulgariaBurkina FasoBurundiCabo VerdeCambodiaCameroonCanadaCaribbean small statesCentral African RepublicCentral Europe and the BalticsChadChileChinaColombiaComorosCongo, Dem. Rep.Congo, Rep.Costa RicaCote d'IvoireCroatiaCyprusCzech RepublicDenmarkDjiboutiDominicaDominican RepublicEarly-demographic dividendEast Asia & PacificEast Asia & Pacific (excluding high income)East Asia & Pacific (IDA & IBRD countries)EcuadorEgypt, Arab Rep.El SalvadorEquatorial GuineaEritreaEstoniaEthiopiaEuro areaEurope & Central AsiaEurope & Central Asia (excluding high income)Europe & Central Asia (IDA & IBRD countries)European UnionFaroe IslandsFijiFinlandFragile and conflict affected situationsFranceGabonGambia, TheGeorgiaGermanyGhanaGreeceGrenadaGuatemalaGuineaGuinea-BissauGuyanaHaitiHeavily indebted poor countries (HIPC)High incomeHondurasHong Kong SAR, ChinaHungaryIBRD onlyIcelandIDA & IBRD totalIDA blendIDA onlyIDA totalIndiaIndonesiaIran, Islamic Rep.IraqIrelandIsraelItalyJamaicaJapanJordanKazakhstanKenyaKiribatiKorea, Rep.KosovoKuwaitKyrgyz RepublicLao PDRLate-demographic dividendLatin America & Caribbean Latin America & Caribbean (excluding high income)Latin America & the Caribbean (IDA & IBRD countries)LatviaLeast developed countries: UN classificationLebanonLesothoLiberiaLibyaLithuaniaLow & middle incomeLow incomeLower middle incomeLuxembourgMacao SAR, ChinaMacedonia, FYRMadagascarMalawiMalaysiaMaldivesMaliMaltaMauritaniaMauritiusMexicoMiddle East & North AfricaMiddle East & North Africa (excluding high income)Middle East & North Africa (IDA & IBRD countries)Middle incomeMoldovaMongoliaMontenegroMoroccoMozambiqueNamibiaNepalNetherlandsNew ZealandNicaraguaNigerNigeriaNorth AmericaNorwayOECD membersOmanOther small statesPacific island small statesPakistanPanamaPapua New GuineaParaguayPeruPhilippinesPolandPortugalPost-demographic dividendPre-demographic dividendQatarRomaniaRussian FederationRwandaSaudi ArabiaSenegalSerbiaSeychellesSierra LeoneSingaporeSlovak RepublicSloveniaSmall statesSolomon IslandsSouth AfricaSouth AsiaSouth Asia (IDA & IBRD)SpainSri LankaSt. Kitts and NevisSt. LuciaSt. Vincent and the GrenadinesSub-Saharan Africa Sub-Saharan Africa (excluding high income)Sub-Saharan Africa (IDA & IBRD countries)SudanSurinameSwazilandSwedenSwitzerlandSyrian Arab RepublicTajikistanTanzaniaThailandTimor-LesteTogoTongaTrinidad and TobagoTunisiaTurkeyTurkmenistanUgandaUkraineUnited KingdomUnited StatesUpper middle incomeUruguayVanuatuVenezuela, RBVietnamWest Bank and GazaWorldYemen, Rep.ZambiaZimbabwe Timeline:
This timeline shows a graph from 1978 to 2015 of Costa Rica. No data until 1977. Number of actual observations by date: 38.
Source name:
World Development Indicators
Source organization:
World Bank national accounts data files.
Categories, topics:
Economy & Growth, Environment
Last updated:
apr 23, 2017
Indicators value changes by year
Maximum:
21.834
jan 1, 2007
At the date of observation
Value
Absolute change
Change from previous value
jan 1, 1978
17.169
+17.169
0.0%
jan 1, 1979
13.294
-3.876
-22.57%
jan 1, 1980
12.085
-1.209
-9.1%
jan 1, 1981
12.626
+0.541
4.48%
jan 1, 1982
16.063
+3.438
27.23%
jan 1, 1983
15.96
-0.103
-0.64%
jan 1, 1984
9.053
-6.907
-43.27%
jan 1, 1985
11.955
+2.902
32.05%
jan 1, 1986
11.504
-0.451
-3.77%
jan 1, 1987
14.648
+3.143
27.32%
jan 1, 1988
15.028
+0.381
2.6%
jan 1, 1989
15.199
+0.171
1.14%
jan 1, 1990
11.531
-3.668
-24.13%
jan 1, 1991
12.006
+0.475
4.12%
jan 1, 1992
13.357
+1.351
11.25%
jan 1, 1993
15.521
+2.164
16.2%
jan 1, 1994
13.764
-1.756
-11.32%
jan 1, 1995
14.897
+1.132
8.23%
jan 1, 1996
14.937
+0.04
0.27%
jan 1, 1997
12.383
-2.554
-17.1%
jan 1, 1998
13.544
+1.162
9.38%
jan 1, 1999
15.828
+2.284
16.86%
jan 1, 2000
13.536
-2.292
-14.48%
jan 1, 2001
13.565
+0.029
0.21%
jan 1, 2002
14.639
+1.073
7.91%
jan 1, 2003
16.229
+1.59
10.86%
jan 1, 2004
16.26
+0.031
0.19%
jan 1, 2005
19.134
+2.874
17.67%
jan 1, 2006
19.385
+0.251
1.31%
jan 1, 2007
21.834
+2.449
12.63%
jan 1, 2008
18.983
-2.851
-13.06%
jan 1, 2009
18.161
-0.822
-4.33%
jan 1, 2010
14.858
-3.302
-18.18%
jan 1, 2011
17.12
+2.262
15.22%
jan 1, 2012
16.433
-0.687
-4.01%
jan 1, 2013
15.586
-0.847
-5.15%
jan 1, 2014
15.043
-0.544
-3.49%
jan 1, 2015
14.83
-0.213
-1.42%
Ranking of countries by current statistics by years


Comments: