29
/
en
AIzaSyAYiBZKx7MnpbEhh9jyipgxe19OcubqV5w
April 1, 2024
214974
Oman
OMN
true
2
1
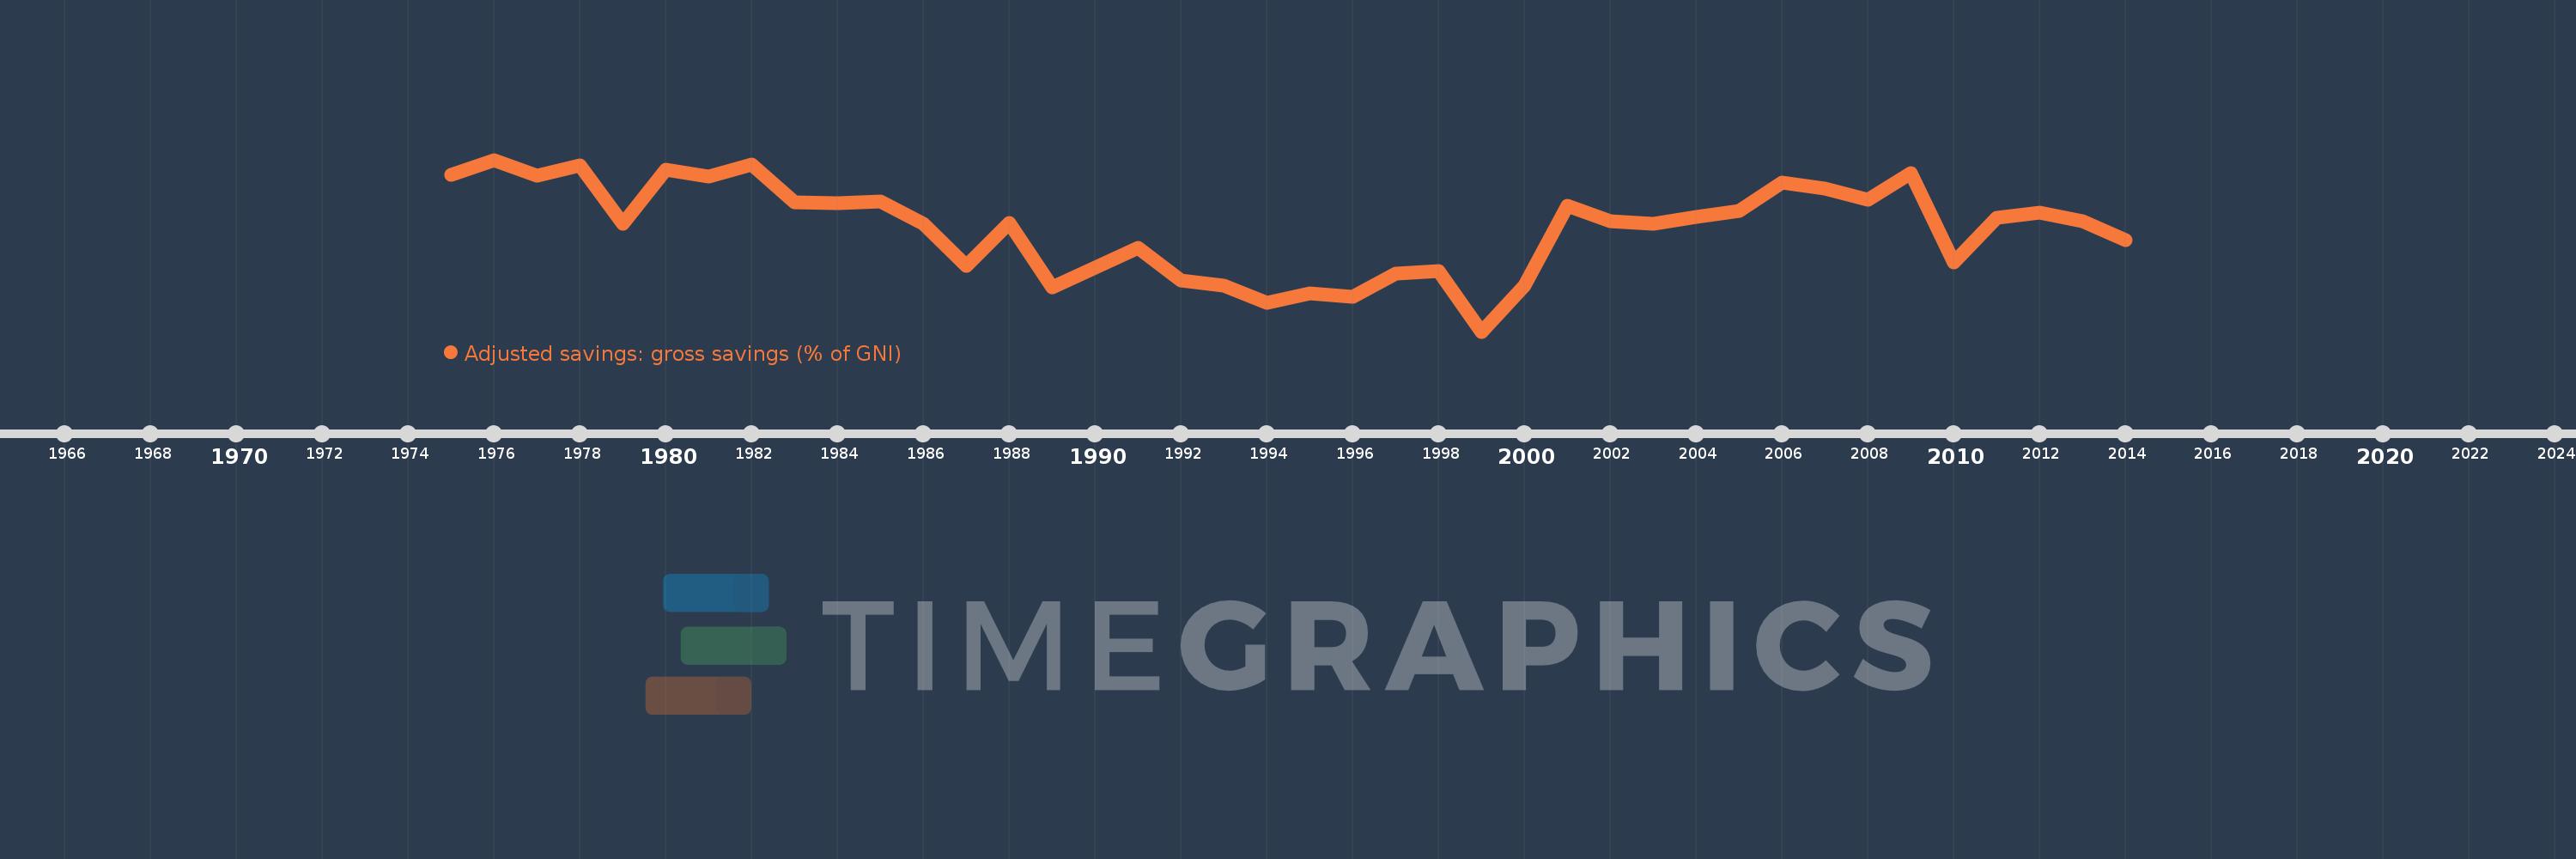
Adjusted savings: gross savings (% of GNI)
2014,2013,2012,2011,2010,2009,2008,2007,2006,2005,2004,2003,2002,2001,2000,1999,1998,1997,1996,1995,1994,1993,1992,1991,1989,1988,1987,1986,1985,1984,1983,1982,1981,1980,1979,1978,1977,1976,1975
This statistics in other country:
AfghanistanAlbaniaAlgeriaAngolaAntigua and BarbudaArab WorldArgentinaArmeniaAustraliaAustriaAzerbaijanBahamas, TheBahrainBangladeshBarbadosBelarusBelgiumBelizeBeninBermudaBhutanBoliviaBosnia and HerzegovinaBotswanaBrazilBrunei DarussalamBulgariaBurkina FasoBurundiCabo VerdeCambodiaCameroonCanadaCaribbean small statesCentral African RepublicCentral Europe and the BalticsChadChileChinaColombiaComorosCongo, Dem. Rep.Congo, Rep.Costa RicaCote d'IvoireCroatiaCyprusCzech RepublicDenmarkDjiboutiDominicaDominican RepublicEarly-demographic dividendEast Asia & PacificEast Asia & Pacific (excluding high income)East Asia & Pacific (IDA & IBRD countries)EcuadorEgypt, Arab Rep.El SalvadorEquatorial GuineaEritreaEstoniaEthiopiaEuro areaEurope & Central AsiaEurope & Central Asia (excluding high income)Europe & Central Asia (IDA & IBRD countries)European UnionFaroe IslandsFijiFinlandFragile and conflict affected situationsFranceGabonGambia, TheGeorgiaGermanyGhanaGreeceGrenadaGuatemalaGuineaGuinea-BissauGuyanaHaitiHeavily indebted poor countries (HIPC)High incomeHondurasHong Kong SAR, ChinaHungaryIBRD onlyIcelandIDA & IBRD totalIDA blendIDA onlyIDA totalIndiaIndonesiaIran, Islamic Rep.IraqIrelandIsraelItalyJamaicaJapanJordanKazakhstanKenyaKiribatiKorea, Rep.KosovoKuwaitKyrgyz RepublicLao PDRLate-demographic dividendLatin America & Caribbean Latin America & Caribbean (excluding high income)Latin America & the Caribbean (IDA & IBRD countries)LatviaLeast developed countries: UN classificationLebanonLesothoLiberiaLibyaLithuaniaLow & middle incomeLow incomeLower middle incomeLuxembourgMacao SAR, ChinaMacedonia, FYRMadagascarMalawiMalaysiaMaldivesMaliMaltaMauritaniaMauritiusMexicoMiddle East & North AfricaMiddle East & North Africa (excluding high income)Middle East & North Africa (IDA & IBRD countries)Middle incomeMoldovaMongoliaMontenegroMoroccoMozambiqueNamibiaNepalNetherlandsNew ZealandNicaraguaNigerNigeriaNorth AmericaNorwayOECD membersOmanOther small statesPacific island small statesPakistanPanamaPapua New GuineaParaguayPeruPhilippinesPolandPortugalPost-demographic dividendPre-demographic dividendQatarRomaniaRussian FederationRwandaSaudi ArabiaSenegalSerbiaSeychellesSierra LeoneSingaporeSlovak RepublicSloveniaSmall statesSolomon IslandsSouth AfricaSouth AsiaSouth Asia (IDA & IBRD)SpainSri LankaSt. Kitts and NevisSt. LuciaSt. Vincent and the GrenadinesSub-Saharan Africa Sub-Saharan Africa (excluding high income)Sub-Saharan Africa (IDA & IBRD countries)SudanSurinameSwazilandSwedenSwitzerlandSyrian Arab RepublicTajikistanTanzaniaThailandTimor-LesteTogoTongaTrinidad and TobagoTunisiaTurkeyTurkmenistanUgandaUkraineUnited KingdomUnited StatesUpper middle incomeUruguayVanuatuVenezuela, RBVietnamWest Bank and GazaWorldYemen, Rep.ZambiaZimbabwe Timeline:
This timeline shows a graph from 1975 to 2014 of Oman. No data until 1974. Number of actual observations by date: 39.
Source name:
World Development Indicators
Source organization:
World Bank national accounts data files.
Categories, topics:
Economy & Growth, Environment
Last updated:
apr 23, 2017
Indicators value changes by year
Maximum:
44.648
jan 1, 1976
At the date of observation
Value
Absolute change
Change from previous value
jan 1, 1975
40.855
+40.855
0.0%
jan 1, 1976
44.648
+3.793
9.28%
jan 1, 1977
40.699
-3.949
-8.85%
jan 1, 1978
43.277
+2.578
6.33%
jan 1, 1979
28.532
-14.745
-34.07%
jan 1, 1980
42.189
+13.657
47.87%
jan 1, 1981
40.391
-1.798
-4.26%
jan 1, 1982
43.387
+2.996
7.42%
jan 1, 1983
33.908
-9.479
-21.85%
jan 1, 1984
33.673
-0.235
-0.69%
jan 1, 1985
34.207
+0.534
1.58%
jan 1, 1986
28.612
-5.595
-16.36%
jan 1, 1987
18.091
-10.521
-36.77%
jan 1, 1988
28.895
+10.805
59.73%
jan 1, 1989
12.634
-16.261
-56.28%
jan 1, 1991
22.477
+9.843
77.9%
jan 1, 1992
14.267
-8.21
-36.53%
jan 1, 1993
13.149
-1.118
-7.84%
jan 1, 1994
8.783
-4.366
-33.21%
jan 1, 1995
11.001
+2.219
25.26%
jan 1, 1996
10.234
-0.767
-6.97%
jan 1, 1997
16.098
+5.864
57.3%
jan 1, 1998
16.796
+0.697
4.33%
jan 1, 1999
1.499
-15.297
-91.08%
jan 1, 2000
13.063
+11.564
771.55%
jan 1, 2001
33.134
+20.071
153.64%
jan 1, 2002
29.125
-4.009
-12.1%
jan 1, 2003
28.472
-0.653
-2.24%
jan 1, 2004
30.399
+1.927
6.77%
jan 1, 2005
31.714
+1.315
4.33%
jan 1, 2006
39.03
+7.317
23.07%
jan 1, 2007
37.473
-1.557
-3.99%
jan 1, 2008
34.581
-2.892
-7.72%
jan 1, 2009
41.365
+6.784
19.62%
jan 1, 2010
18.775
-22.591
-54.61%
jan 1, 2011
30.111
+11.336
60.38%
jan 1, 2012
31.426
+1.315
4.37%
jan 1, 2013
29.17
-2.256
-7.18%
jan 1, 2014
24.397
-4.772
-16.36%
Ranking of countries by current statistics by years


Comments: