29
/
en
AIzaSyAYiBZKx7MnpbEhh9jyipgxe19OcubqV5w
April 1, 2024
155544
Indonesia
IDN
true
2
1
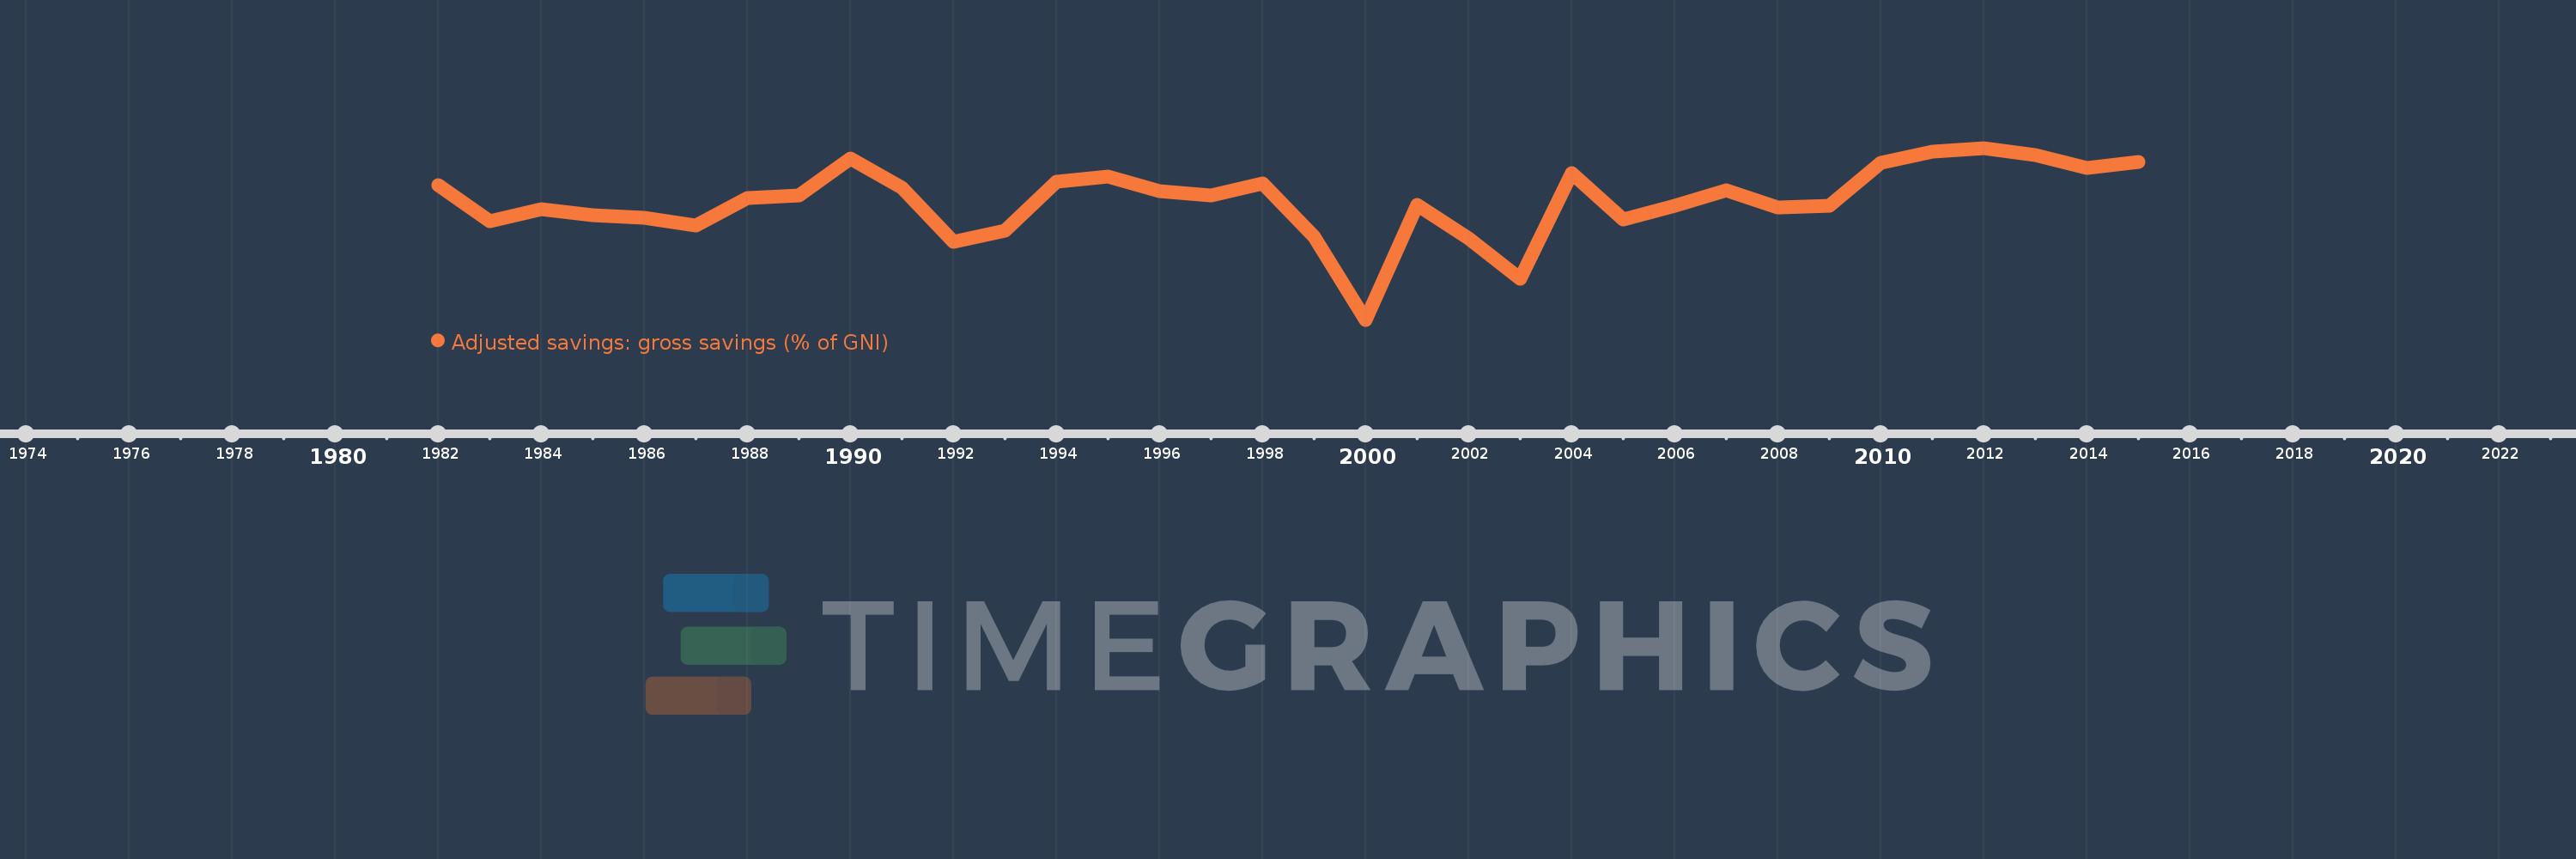
Adjusted savings: gross savings (% of GNI)
2015,2014,2013,2012,2011,2010,2009,2008,2007,2006,2005,2004,2003,2002,2001,2000,1999,1998,1997,1996,1995,1994,1993,1992,1991,1990,1989,1988,1987,1986,1985,1984,1983,1982
This statistics in other country:
AfghanistanAlbaniaAlgeriaAngolaAntigua and BarbudaArab WorldArgentinaArmeniaAustraliaAustriaAzerbaijanBahamas, TheBahrainBangladeshBarbadosBelarusBelgiumBelizeBeninBermudaBhutanBoliviaBosnia and HerzegovinaBotswanaBrazilBrunei DarussalamBulgariaBurkina FasoBurundiCabo VerdeCambodiaCameroonCanadaCaribbean small statesCentral African RepublicCentral Europe and the BalticsChadChileChinaColombiaComorosCongo, Dem. Rep.Congo, Rep.Costa RicaCote d'IvoireCroatiaCyprusCzech RepublicDenmarkDjiboutiDominicaDominican RepublicEarly-demographic dividendEast Asia & PacificEast Asia & Pacific (excluding high income)East Asia & Pacific (IDA & IBRD countries)EcuadorEgypt, Arab Rep.El SalvadorEquatorial GuineaEritreaEstoniaEthiopiaEuro areaEurope & Central AsiaEurope & Central Asia (excluding high income)Europe & Central Asia (IDA & IBRD countries)European UnionFaroe IslandsFijiFinlandFragile and conflict affected situationsFranceGabonGambia, TheGeorgiaGermanyGhanaGreeceGrenadaGuatemalaGuineaGuinea-BissauGuyanaHaitiHeavily indebted poor countries (HIPC)High incomeHondurasHong Kong SAR, ChinaHungaryIBRD onlyIcelandIDA & IBRD totalIDA blendIDA onlyIDA totalIndiaIndonesiaIran, Islamic Rep.IraqIrelandIsraelItalyJamaicaJapanJordanKazakhstanKenyaKiribatiKorea, Rep.KosovoKuwaitKyrgyz RepublicLao PDRLate-demographic dividendLatin America & Caribbean Latin America & Caribbean (excluding high income)Latin America & the Caribbean (IDA & IBRD countries)LatviaLeast developed countries: UN classificationLebanonLesothoLiberiaLibyaLithuaniaLow & middle incomeLow incomeLower middle incomeLuxembourgMacao SAR, ChinaMacedonia, FYRMadagascarMalawiMalaysiaMaldivesMaliMaltaMauritaniaMauritiusMexicoMiddle East & North AfricaMiddle East & North Africa (excluding high income)Middle East & North Africa (IDA & IBRD countries)Middle incomeMoldovaMongoliaMontenegroMoroccoMozambiqueNamibiaNepalNetherlandsNew ZealandNicaraguaNigerNigeriaNorth AmericaNorwayOECD membersOmanOther small statesPacific island small statesPakistanPanamaPapua New GuineaParaguayPeruPhilippinesPolandPortugalPost-demographic dividendPre-demographic dividendQatarRomaniaRussian FederationRwandaSaudi ArabiaSenegalSerbiaSeychellesSierra LeoneSingaporeSlovak RepublicSloveniaSmall statesSolomon IslandsSouth AfricaSouth AsiaSouth Asia (IDA & IBRD)SpainSri LankaSt. Kitts and NevisSt. LuciaSt. Vincent and the GrenadinesSub-Saharan Africa Sub-Saharan Africa (excluding high income)Sub-Saharan Africa (IDA & IBRD countries)SudanSurinameSwazilandSwedenSwitzerlandSyrian Arab RepublicTajikistanTanzaniaThailandTimor-LesteTogoTongaTrinidad and TobagoTunisiaTurkeyTurkmenistanUgandaUkraineUnited KingdomUnited StatesUpper middle incomeUruguayVanuatuVenezuela, RBVietnamWest Bank and GazaWorldYemen, Rep.ZambiaZimbabwe Timeline:
This timeline shows a graph from 1982 to 2015 of Indonesia. No data until 1981. Number of actual observations by date: 34.
Source name:
World Development Indicators
Source organization:
World Bank national accounts data files.
Categories, topics:
Economy & Growth, Environment
Last updated:
apr 23, 2017
Indicators value changes by year
Maximum:
33.967
jan 1, 2012
At the date of observation
Value
Absolute change
Change from previous value
jan 1, 1982
29.664
+29.664
0.0%
jan 1, 1983
25.535
-4.13
-13.92%
jan 1, 1984
26.948
+1.413
5.53%
jan 1, 1985
26.229
-0.719
-2.67%
jan 1, 1986
25.941
-0.288
-1.1%
jan 1, 1987
25.074
-0.867
-3.34%
jan 1, 1988
28.266
+3.192
12.73%
jan 1, 1989
28.51
+0.244
0.86%
jan 1, 1990
32.755
+4.244
14.89%
jan 1, 1991
29.41
-3.345
-10.21%
jan 1, 1992
23.184
-6.226
-21.17%
jan 1, 1993
24.472
+1.288
5.55%
jan 1, 1994
30.146
+5.674
23.18%
jan 1, 1995
30.695
+0.549
1.82%
jan 1, 1996
28.991
-1.704
-5.55%
jan 1, 1997
28.574
-0.417
-1.44%
jan 1, 1998
29.905
+1.332
4.66%
jan 1, 1999
23.762
-6.143
-20.54%
jan 1, 2000
14.29
-9.472
-39.86%
jan 1, 2001
27.395
+13.105
91.7%
jan 1, 2002
23.652
-3.743
-13.66%
jan 1, 2003
18.944
-4.708
-19.9%
jan 1, 2004
31.084
+12.14
64.08%
jan 1, 2005
25.765
-5.318
-17.11%
jan 1, 2006
27.37
+1.605
6.23%
jan 1, 2007
29.127
+1.756
6.42%
jan 1, 2008
27.147
-1.98
-6.8%
jan 1, 2009
27.34
+0.193
0.71%
jan 1, 2010
32.269
+4.929
18.03%
jan 1, 2011
33.569
+1.3
4.03%
jan 1, 2012
33.967
+0.398
1.19%
jan 1, 2013
33.185
-0.782
-2.3%
jan 1, 2014
31.686
-1.499
-4.52%
jan 1, 2015
32.368
+0.682
2.15%
Ranking of countries by current statistics by years


Comments: