29
/
en
AIzaSyAYiBZKx7MnpbEhh9jyipgxe19OcubqV5w
April 1, 2024
225576
Portugal
PRT
true
2
1
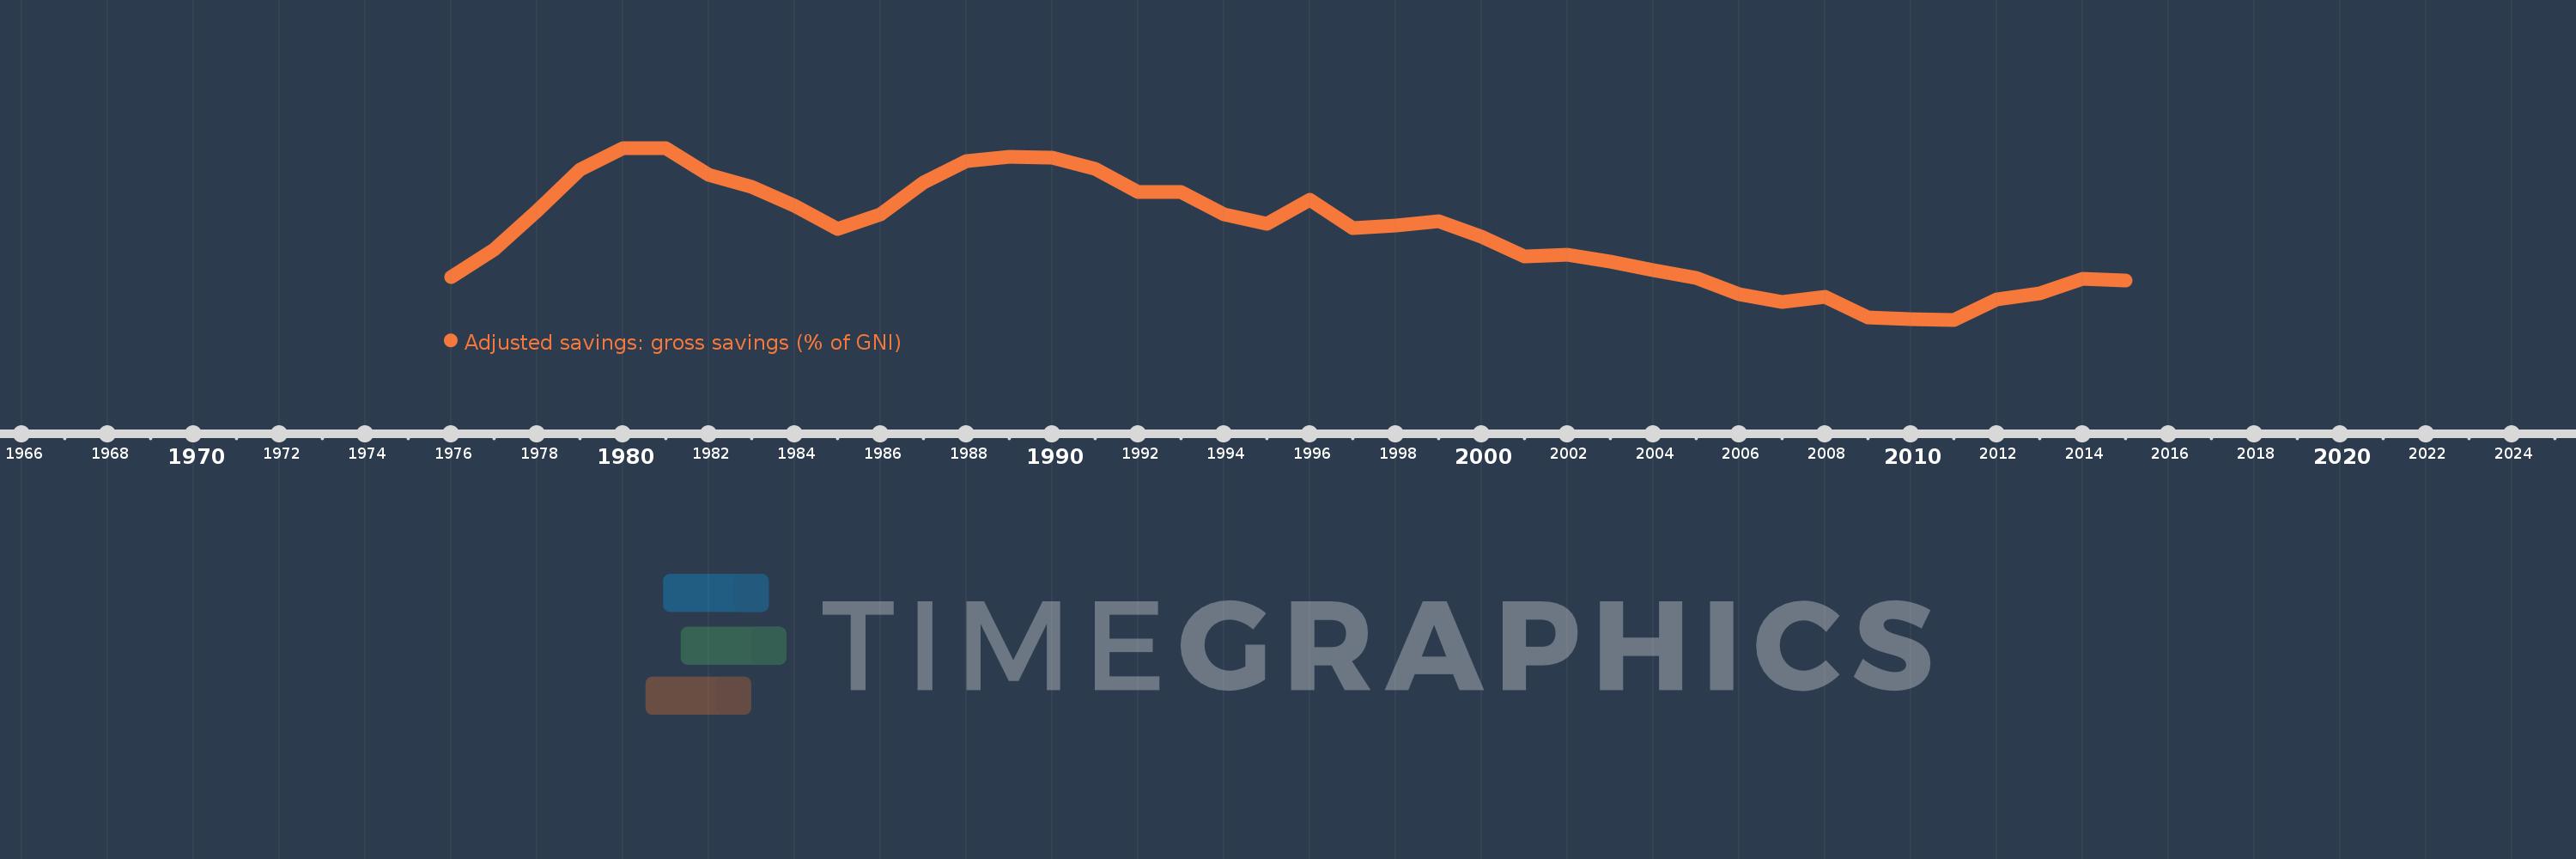
Adjusted savings: gross savings (% of GNI)
2015,2014,2013,2012,2011,2010,2009,2008,2007,2006,2005,2004,2003,2002,2001,2000,1999,1998,1997,1996,1995,1994,1993,1992,1991,1990,1989,1988,1987,1986,1985,1984,1983,1982,1981,1980,1979,1978,1977,1976
This statistics in other country:
AfghanistanAlbaniaAlgeriaAngolaAntigua and BarbudaArab WorldArgentinaArmeniaAustraliaAustriaAzerbaijanBahamas, TheBahrainBangladeshBarbadosBelarusBelgiumBelizeBeninBermudaBhutanBoliviaBosnia and HerzegovinaBotswanaBrazilBrunei DarussalamBulgariaBurkina FasoBurundiCabo VerdeCambodiaCameroonCanadaCaribbean small statesCentral African RepublicCentral Europe and the BalticsChadChileChinaColombiaComorosCongo, Dem. Rep.Congo, Rep.Costa RicaCote d'IvoireCroatiaCyprusCzech RepublicDenmarkDjiboutiDominicaDominican RepublicEarly-demographic dividendEast Asia & PacificEast Asia & Pacific (excluding high income)East Asia & Pacific (IDA & IBRD countries)EcuadorEgypt, Arab Rep.El SalvadorEquatorial GuineaEritreaEstoniaEthiopiaEuro areaEurope & Central AsiaEurope & Central Asia (excluding high income)Europe & Central Asia (IDA & IBRD countries)European UnionFaroe IslandsFijiFinlandFragile and conflict affected situationsFranceGabonGambia, TheGeorgiaGermanyGhanaGreeceGrenadaGuatemalaGuineaGuinea-BissauGuyanaHaitiHeavily indebted poor countries (HIPC)High incomeHondurasHong Kong SAR, ChinaHungaryIBRD onlyIcelandIDA & IBRD totalIDA blendIDA onlyIDA totalIndiaIndonesiaIran, Islamic Rep.IraqIrelandIsraelItalyJamaicaJapanJordanKazakhstanKenyaKiribatiKorea, Rep.KosovoKuwaitKyrgyz RepublicLao PDRLate-demographic dividendLatin America & Caribbean Latin America & Caribbean (excluding high income)Latin America & the Caribbean (IDA & IBRD countries)LatviaLeast developed countries: UN classificationLebanonLesothoLiberiaLibyaLithuaniaLow & middle incomeLow incomeLower middle incomeLuxembourgMacao SAR, ChinaMacedonia, FYRMadagascarMalawiMalaysiaMaldivesMaliMaltaMauritaniaMauritiusMexicoMiddle East & North AfricaMiddle East & North Africa (excluding high income)Middle East & North Africa (IDA & IBRD countries)Middle incomeMoldovaMongoliaMontenegroMoroccoMozambiqueNamibiaNepalNetherlandsNew ZealandNicaraguaNigerNigeriaNorth AmericaNorwayOECD membersOmanOther small statesPacific island small statesPakistanPanamaPapua New GuineaParaguayPeruPhilippinesPolandPortugalPost-demographic dividendPre-demographic dividendQatarRomaniaRussian FederationRwandaSaudi ArabiaSenegalSerbiaSeychellesSierra LeoneSingaporeSlovak RepublicSloveniaSmall statesSolomon IslandsSouth AfricaSouth AsiaSouth Asia (IDA & IBRD)SpainSri LankaSt. Kitts and NevisSt. LuciaSt. Vincent and the GrenadinesSub-Saharan Africa Sub-Saharan Africa (excluding high income)Sub-Saharan Africa (IDA & IBRD countries)SudanSurinameSwazilandSwedenSwitzerlandSyrian Arab RepublicTajikistanTanzaniaThailandTimor-LesteTogoTongaTrinidad and TobagoTunisiaTurkeyTurkmenistanUgandaUkraineUnited KingdomUnited StatesUpper middle incomeUruguayVanuatuVenezuela, RBVietnamWest Bank and GazaWorldYemen, Rep.ZambiaZimbabwe Timeline:
This timeline shows a graph from 1976 to 2015 of Portugal. No data until 1975. Number of actual observations by date: 40.
Source name:
World Development Indicators
Source organization:
World Bank national accounts data files.
Categories, topics:
Economy & Growth, Environment
Last updated:
apr 23, 2017
Indicators value changes by year
Minimum:
10.653
jan 1, 2011
Maximum:
30.402
jan 1, 1981
At the date of observation
Value
Absolute change
Change from previous value
jan 1, 1976
15.518
+15.518
0.0%
jan 1, 1977
18.748
+3.229
20.81%
jan 1, 1978
23.201
+4.453
23.75%
jan 1, 1979
27.927
+4.727
20.37%
jan 1, 1980
30.37
+2.442
8.75%
jan 1, 1981
30.402
+0.033
0.11%
jan 1, 1982
27.339
-3.063
-10.07%
jan 1, 1983
25.896
-1.443
-5.28%
jan 1, 1984
23.786
-2.11
-8.15%
jan 1, 1985
21.051
-2.735
-11.5%
jan 1, 1986
22.743
+1.692
8.04%
jan 1, 1987
26.43
+3.687
16.21%
jan 1, 1988
28.892
+2.462
9.31%
jan 1, 1989
29.346
+0.453
1.57%
jan 1, 1990
29.334
-0.011
-0.04%
jan 1, 1991
27.96
-1.374
-4.68%
jan 1, 1992
25.289
-2.671
-9.55%
jan 1, 1993
25.306
+0.017
0.07%
jan 1, 1994
22.78
-2.526
-9.98%
jan 1, 1995
21.709
-1.07
-4.7%
jan 1, 1996
24.448
+2.738
12.61%
jan 1, 1997
21.169
-3.279
-13.41%
jan 1, 1998
21.461
+0.292
1.38%
jan 1, 1999
22.027
+0.566
2.64%
jan 1, 2000
20.172
-1.855
-8.42%
jan 1, 2001
17.927
-2.245
-11.13%
jan 1, 2002
18.093
+0.166
0.93%
jan 1, 2003
17.342
-0.751
-4.15%
jan 1, 2004
16.303
-1.039
-5.99%
jan 1, 2005
15.428
-0.874
-5.36%
jan 1, 2006
13.575
-1.853
-12.01%
jan 1, 2007
12.648
-0.927
-6.83%
jan 1, 2008
13.285
+0.637
5.03%
jan 1, 2009
10.945
-2.34
-17.61%
jan 1, 2010
10.712
-0.233
-2.13%
jan 1, 2011
10.653
-0.058
-0.55%
jan 1, 2012
12.975
+2.322
21.79%
jan 1, 2013
13.712
+0.737
5.68%
jan 1, 2014
15.397
+1.685
12.29%
jan 1, 2015
15.129
-0.267
-1.74%
Ranking of countries by current statistics by years


Comments: