29
/
en
AIzaSyAYiBZKx7MnpbEhh9jyipgxe19OcubqV5w
April 1, 2024
248067
Spain
ESP
true
2
1
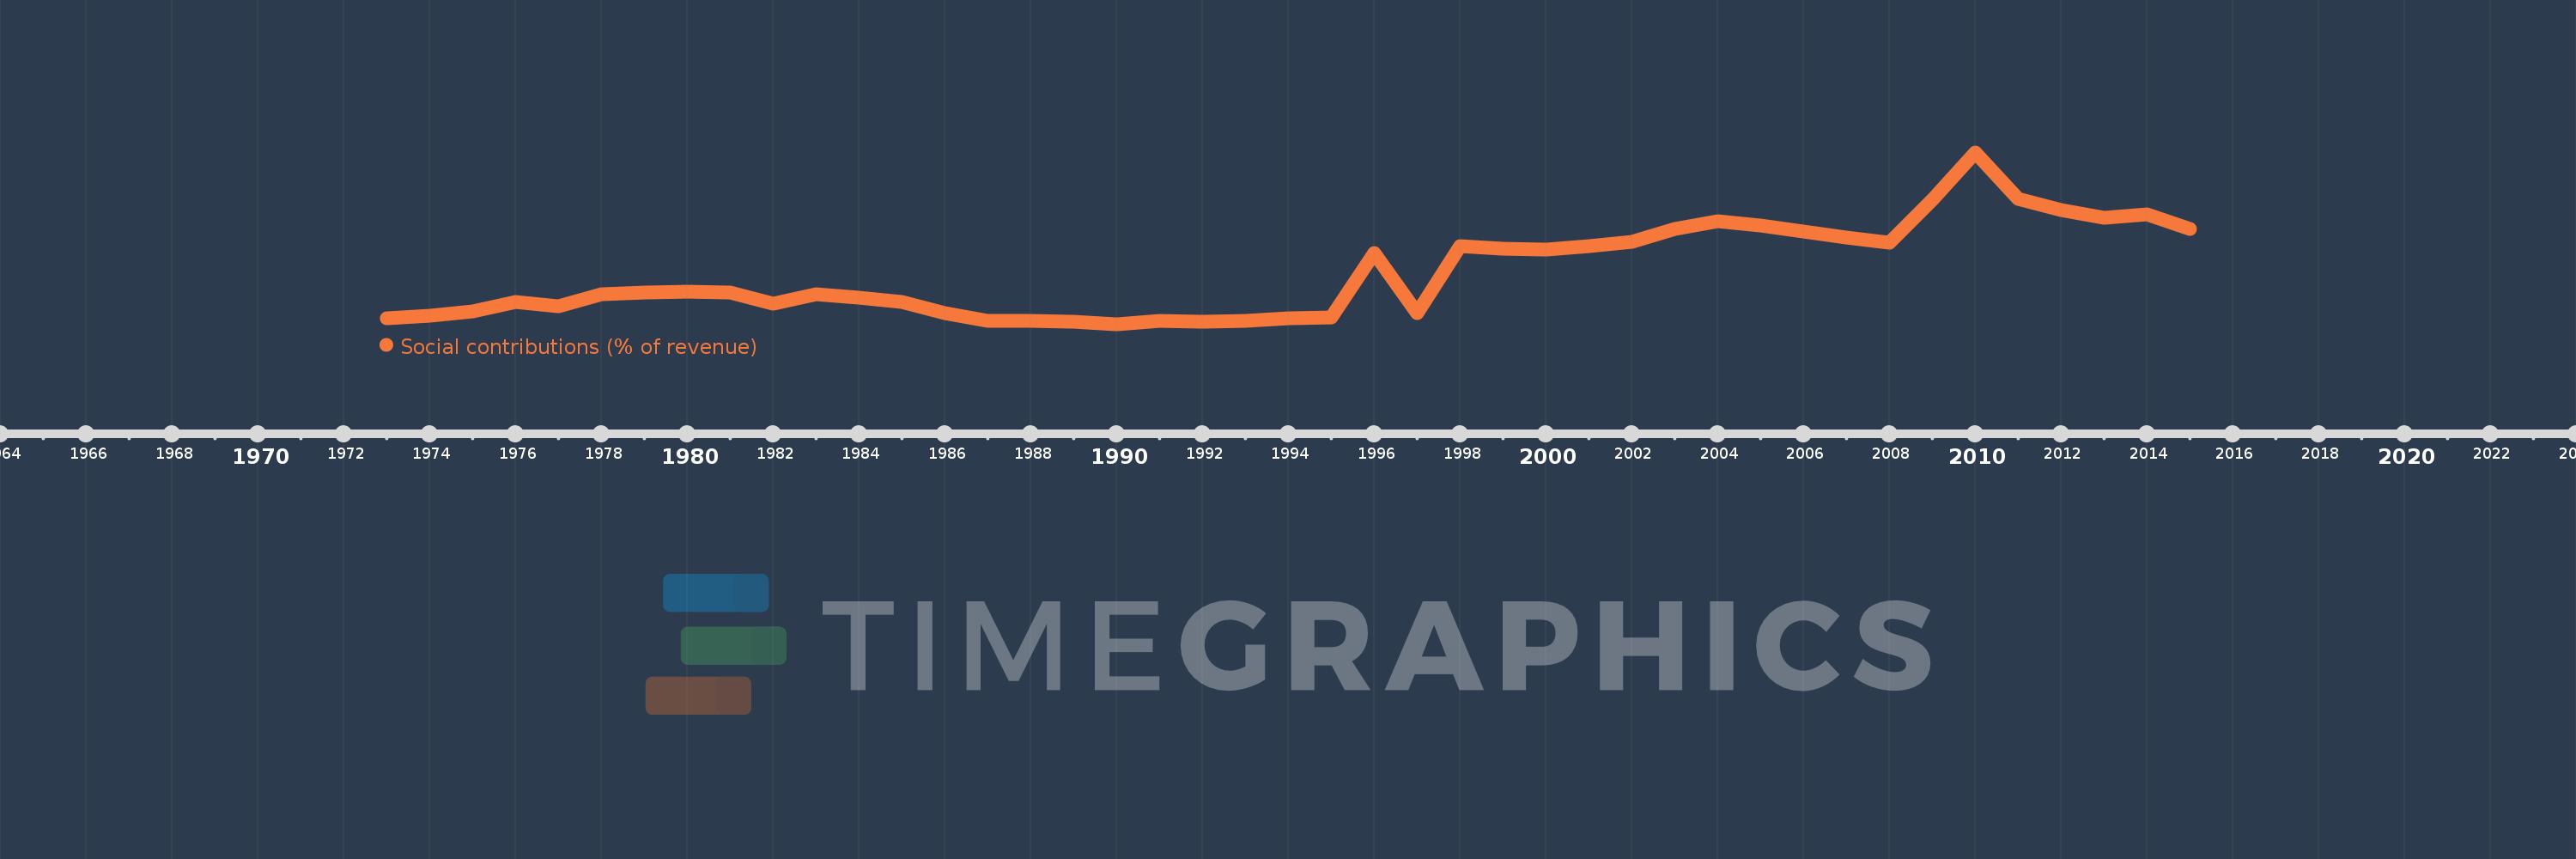
Social contributions (% of revenue)
2015,2014,2013,2012,2011,2010,2009,2008,2007,2006,2005,2004,2003,2002,2001,2000,1999,1998,1997,1996,1995,1994,1993,1992,1991,1990,1989,1988,1987,1986,1985,1984,1983,1982,1981,1980,1979,1978,1977,1976,1975,1974,1973
This statistics in other country:
Timeline:
This timeline shows a graph from 1973 to 2015 of Spain. No data until 1972. Number of actual observations by date: 43.
Source name:
World Development Indicators
Source organization:
International Monetary Fund, Government Finance Statistics Yearbook and data files.
Categories, topics:
Public Sector
Last updated:
apr 23, 2017
Indicators value changes by year
Minimum:
36.566
jan 1, 1990
Maximum:
98.836
jan 1, 2010
At the date of observation
Value
Absolute change
Change from previous value
jan 1, 1973
38.839
+38.839
0.0%
jan 1, 1974
39.791
+0.953
2.45%
jan 1, 1975
41.288
+1.497
3.76%
jan 1, 1976
44.561
+3.273
7.93%
jan 1, 1977
43.04
-1.521
-3.41%
jan 1, 1978
47.409
+4.369
10.15%
jan 1, 1979
47.92
+0.511
1.08%
jan 1, 1980
48.213
+0.293
0.61%
jan 1, 1981
47.916
-0.296
-0.61%
jan 1, 1982
44.009
-3.907
-8.15%
jan 1, 1983
47.331
+3.322
7.55%
jan 1, 1984
46.186
-1.145
-2.42%
jan 1, 1985
44.529
-1.657
-3.59%
jan 1, 1986
40.565
-3.964
-8.9%
jan 1, 1987
37.845
-2.721
-6.71%
jan 1, 1988
37.774
-0.07
-0.19%
jan 1, 1989
37.417
-0.357
-0.95%
jan 1, 1990
36.566
-0.851
-2.27%
jan 1, 1991
37.627
+1.061
2.9%
jan 1, 1992
37.357
-0.27
-0.72%
jan 1, 1993
37.752
+0.395
1.06%
jan 1, 1994
38.597
+0.845
2.24%
jan 1, 1995
39.154
+0.557
1.44%
jan 1, 1996
62.454
+23.3
59.51%
jan 1, 1997
40.603
-21.851
-34.99%
jan 1, 1998
64.973
+24.37
60.02%
jan 1, 1999
64.061
-0.912
-1.4%
jan 1, 2000
63.737
-0.324
-0.51%
jan 1, 2001
64.918
+1.181
1.85%
jan 1, 2002
66.441
+1.523
2.35%
jan 1, 2003
71.076
+4.635
6.98%
jan 1, 2004
73.766
+2.69
3.78%
jan 1, 2005
72.474
-1.292
-1.75%
jan 1, 2006
70.042
-2.432
-3.36%
jan 1, 2007
67.999
-2.043
-2.92%
jan 1, 2008
66.085
-1.914
-2.82%
jan 1, 2009
81.723
+15.638
23.66%
jan 1, 2010
98.836
+17.113
20.94%
jan 1, 2011
81.85
-16.986
-17.19%
jan 1, 2012
77.932
-3.919
-4.79%
jan 1, 2013
75.114
-2.817
-3.62%
jan 1, 2014
76.273
+1.159
1.54%
jan 1, 2015
71.102
-5.172
-6.78%
Ranking of countries by current statistics by years


Comments: