29
/
en
AIzaSyAYiBZKx7MnpbEhh9jyipgxe19OcubqV5w
April 1, 2024
233246
San Marino
SMR
true
2
1
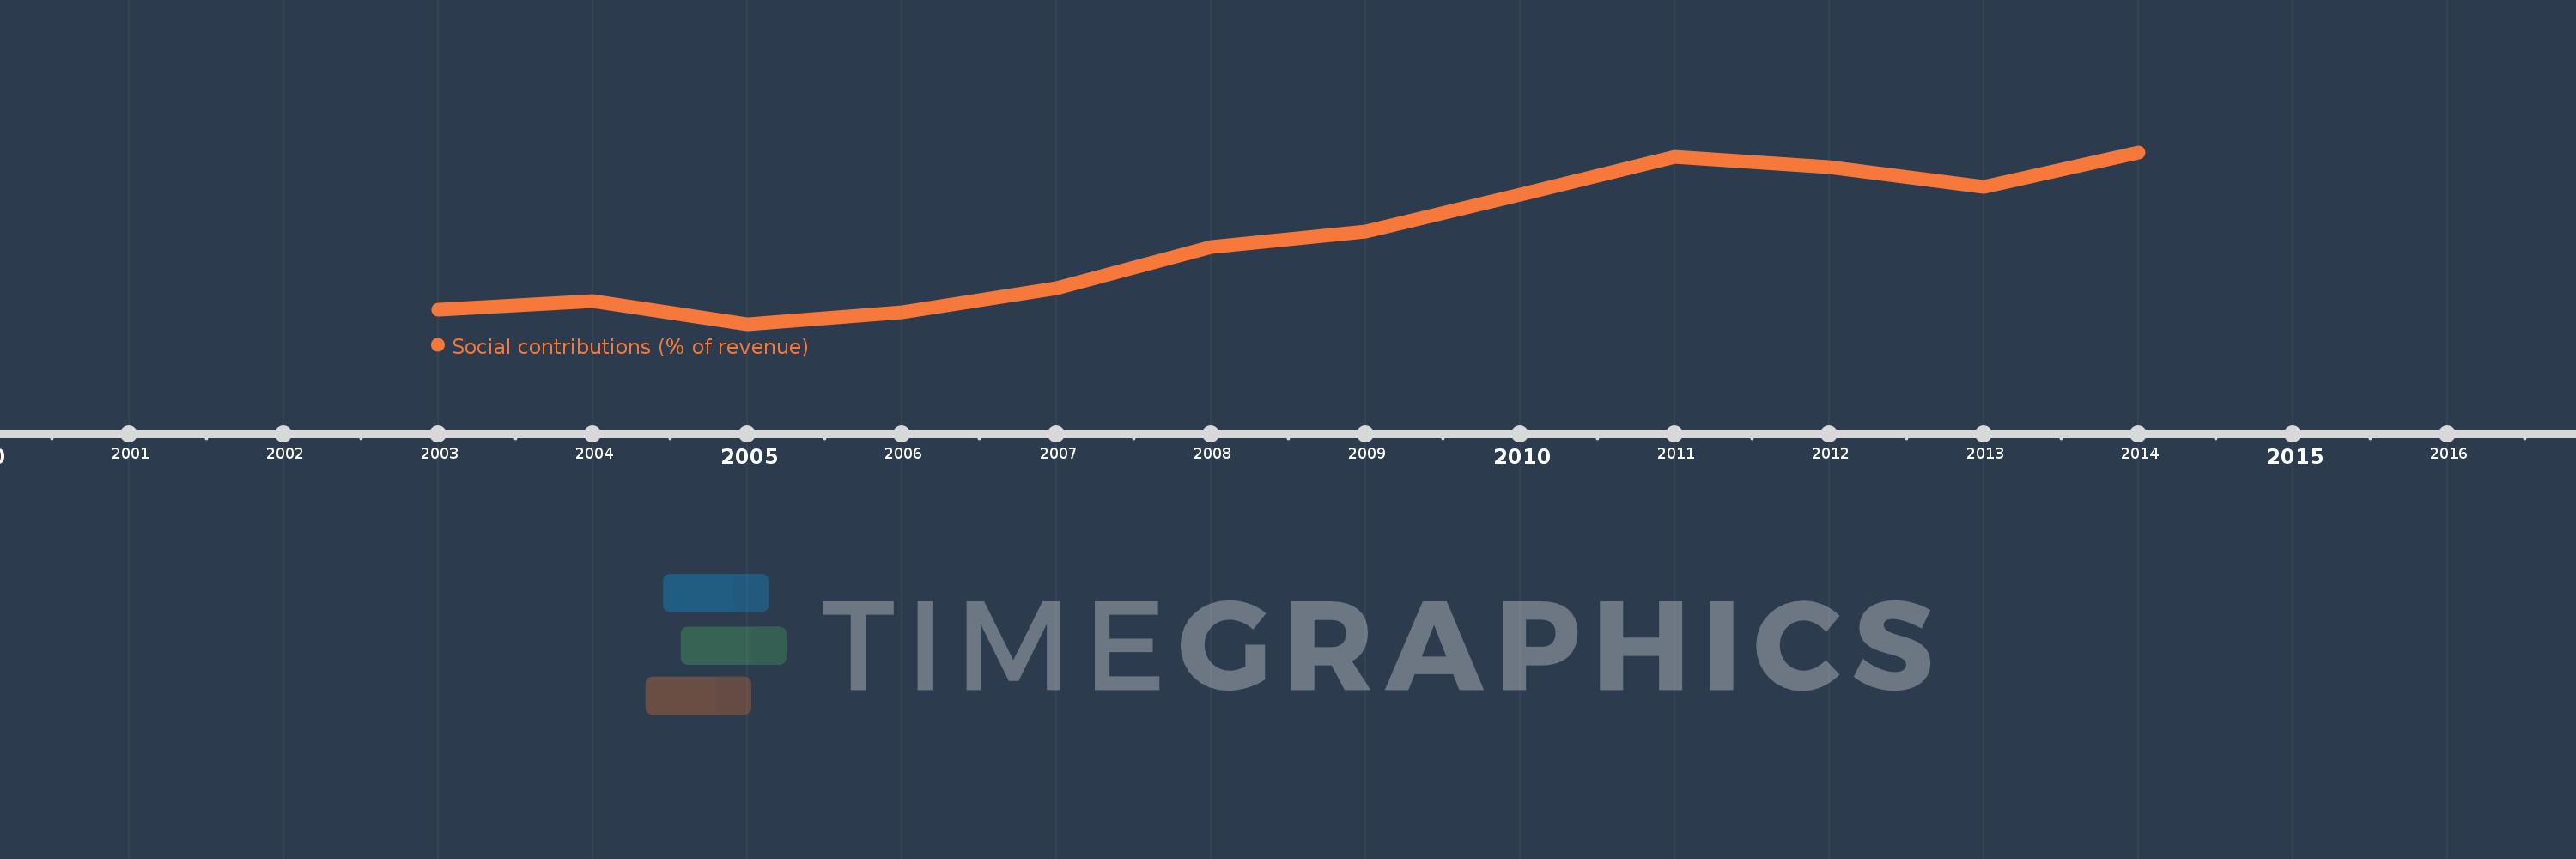
Social contributions (% of revenue)
2014,2013,2012,2011,2010,2009,2008,2007,2006,2005,2004,2003
This statistics in other country:
Timeline:
This timeline shows a graph from 2003 to 2014 of San Marino. No data until 2002. Number of actual observations by date: 12.
Source name:
World Development Indicators
Source organization:
International Monetary Fund, Government Finance Statistics Yearbook and data files.
Categories, topics:
Public Sector
Last updated:
apr 23, 2017
Indicators value changes by year
Minimum:
20.559
jan 1, 2005
At the date of observation
Value
Absolute change
Change from previous value
jan 1, 2003
21.498
+21.498
0.0%
jan 1, 2004
22.084
+0.587
2.73%
jan 1, 2005
20.559
-1.525
-6.91%
jan 1, 2006
21.32
+0.76
3.7%
jan 1, 2007
22.944
+1.625
7.62%
jan 1, 2008
25.668
+2.724
11.87%
jan 1, 2009
26.663
+0.995
3.87%
jan 1, 2010
29.121
+2.458
9.22%
jan 1, 2011
31.595
+2.474
8.49%
jan 1, 2012
30.891
-0.704
-2.23%
jan 1, 2013
29.637
-1.254
-4.06%
jan 1, 2014
31.88
+2.243
7.57%
Ranking of countries by current statistics by years


Comments: