29
/
en
AIzaSyAYiBZKx7MnpbEhh9jyipgxe19OcubqV5w
April 1, 2024
33880
European Union
EUU
false
2
1
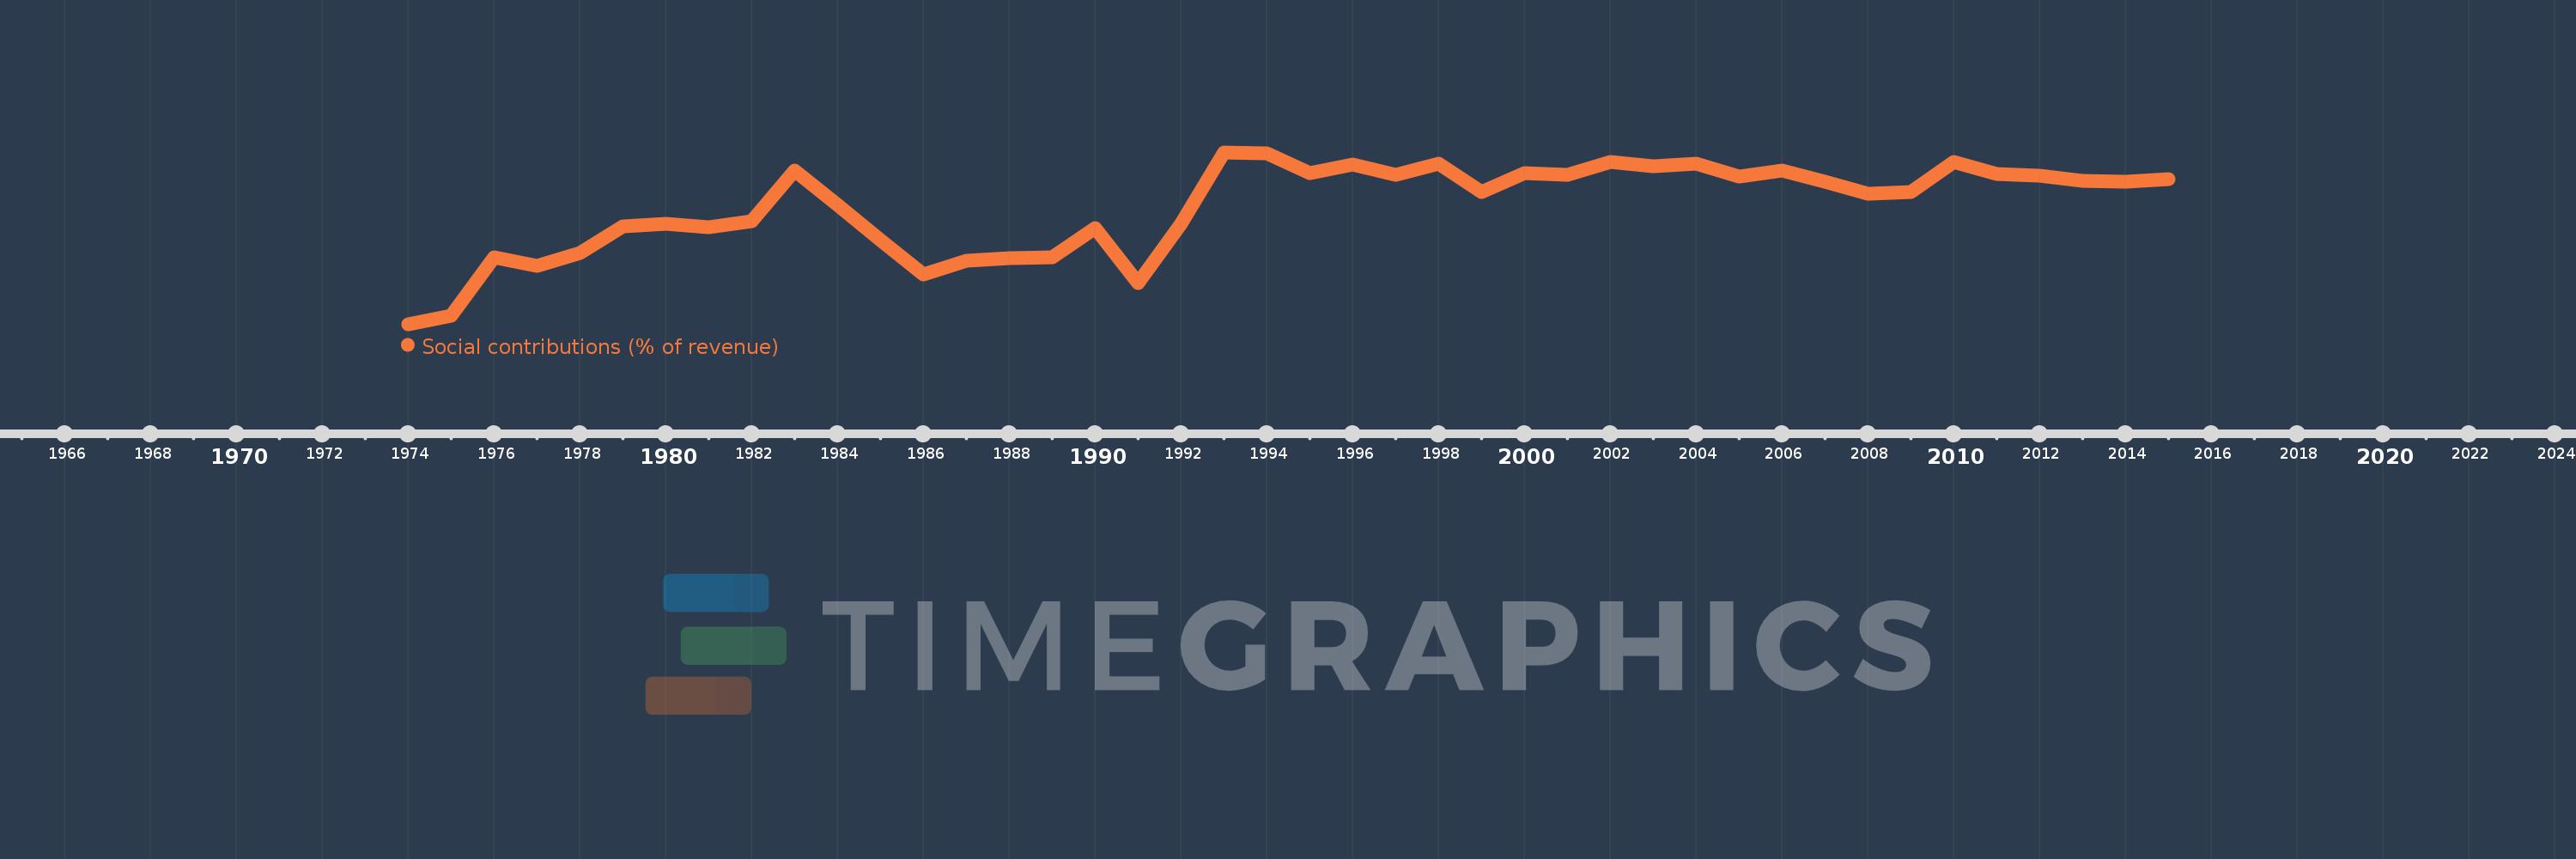
Social contributions (% of revenue)
2015,2014,2013,2012,2011,2010,2009,2008,2007,2006,2005,2004,2003,2002,2001,2000,1999,1998,1997,1996,1995,1994,1993,1992,1991,1990,1989,1988,1987,1986,1985,1984,1983,1982,1981,1980,1979,1978,1977,1976,1975,1974
This statistics in other country:
Timeline:
This timeline shows a graph from 1974 to 2015 of European Union. No data until 1973. Number of actual observations by date: 42.
Source name:
World Development Indicators
Source organization:
International Monetary Fund, Government Finance Statistics Yearbook and data files.
Categories, topics:
Public Sector
Last updated:
apr 23, 2017
Indicators value changes by year
Minimum:
23.097
jan 1, 1974
Maximum:
34.324
jan 1, 1993
At the date of observation
Value
Absolute change
Change from previous value
jan 1, 1974
23.097
+23.097
0.0%
jan 1, 1975
23.639
+0.542
2.35%
jan 1, 1976
27.46
+3.822
16.17%
jan 1, 1977
26.924
-0.536
-1.95%
jan 1, 1978
27.746
+0.822
3.05%
jan 1, 1979
29.506
+1.76
6.34%
jan 1, 1980
29.677
+0.171
0.58%
jan 1, 1981
29.417
-0.26
-0.88%
jan 1, 1982
29.855
+0.438
1.49%
jan 1, 1983
33.157
+3.302
11.06%
jan 1, 1984
30.919
-2.238
-6.75%
jan 1, 1985
28.578
-2.34
-7.57%
jan 1, 1986
26.364
-2.214
-7.75%
jan 1, 1987
27.249
+0.884
3.35%
jan 1, 1988
27.409
+0.161
0.59%
jan 1, 1989
27.474
+0.065
0.24%
jan 1, 1990
29.381
+1.906
6.94%
jan 1, 1991
25.802
-3.579
-12.18%
jan 1, 1992
29.661
+3.86
14.96%
jan 1, 1993
34.324
+4.662
15.72%
jan 1, 1994
34.238
-0.085
-0.25%
jan 1, 1995
32.999
-1.239
-3.62%
jan 1, 1996
33.506
+0.507
1.54%
jan 1, 1997
32.834
-0.673
-2.01%
jan 1, 1998
33.6
+0.767
2.33%
jan 1, 1999
31.716
-1.884
-5.61%
jan 1, 2000
32.953
+1.236
3.9%
jan 1, 2001
32.834
-0.119
-0.36%
jan 1, 2002
33.721
+0.887
2.7%
jan 1, 2003
33.428
-0.292
-0.87%
jan 1, 2004
33.573
+0.145
0.43%
jan 1, 2005
32.745
-0.828
-2.47%
jan 1, 2006
33.122
+0.377
1.15%
jan 1, 2007
32.41
-0.712
-2.15%
jan 1, 2008
31.615
-0.796
-2.45%
jan 1, 2009
31.748
+0.134
0.42%
jan 1, 2010
33.727
+1.979
6.23%
jan 1, 2011
32.907
-0.82
-2.43%
jan 1, 2012
32.778
-0.129
-0.39%
jan 1, 2013
32.457
-0.32
-0.98%
jan 1, 2014
32.437
-0.02
-0.06%
jan 1, 2015
32.554
+0.117
0.36%
Ranking of countries by current statistics by years


Comments: