29
/
en
AIzaSyAYiBZKx7MnpbEhh9jyipgxe19OcubqV5w
April 1, 2024
208458
Netherlands
NLD
true
2
1
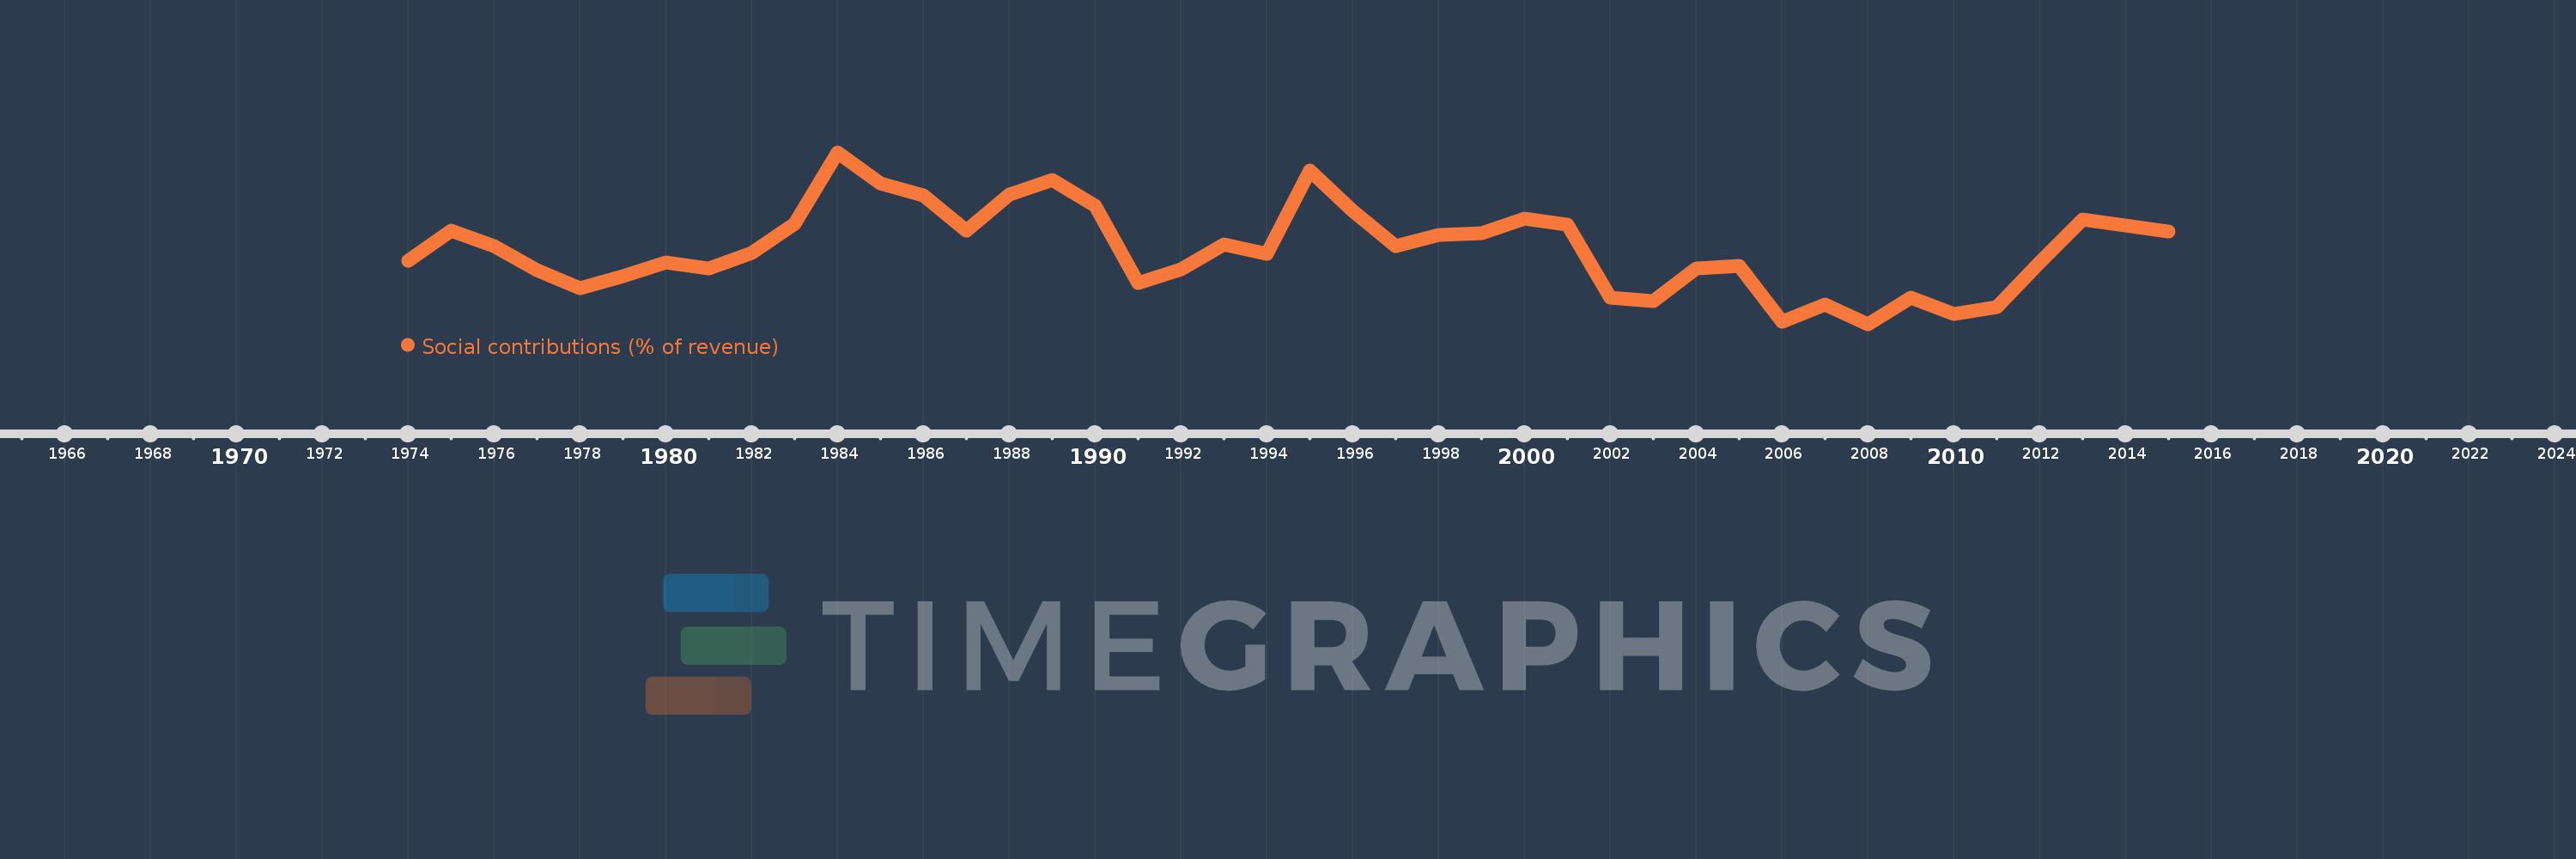
Social contributions (% of revenue)
2015,2014,2013,2012,2011,2010,2009,2008,2007,2006,2005,2004,2003,2002,2001,2000,1999,1998,1997,1996,1995,1994,1993,1992,1991,1990,1989,1988,1987,1986,1985,1984,1983,1982,1981,1980,1979,1978,1977,1976,1975,1974
This statistics in other country:
Timeline:
This timeline shows a graph from 1974 to 2015 of Netherlands. No data until 1973. Number of actual observations by date: 42.
Source name:
World Development Indicators
Source organization:
International Monetary Fund, Government Finance Statistics Yearbook and data files.
Categories, topics:
Public Sector
Last updated:
apr 23, 2017
Indicators value changes by year
Minimum:
33.591
jan 1, 2008
Maximum:
41.428
jan 1, 1984
At the date of observation
Value
Absolute change
Change from previous value
jan 1, 1974
36.506
+36.506
0.0%
jan 1, 1975
37.866
+1.36
3.73%
jan 1, 1976
37.148
-0.718
-1.9%
jan 1, 1977
36.053
-1.095
-2.95%
jan 1, 1978
35.23
-0.823
-2.28%
jan 1, 1979
35.78
+0.55
1.56%
jan 1, 1980
36.416
+0.636
1.78%
jan 1, 1981
36.135
-0.281
-0.77%
jan 1, 1982
36.837
+0.701
1.94%
jan 1, 1983
38.163
+1.326
3.6%
jan 1, 1984
41.428
+3.266
8.56%
jan 1, 1985
40.03
-1.398
-3.38%
jan 1, 1986
39.478
-0.552
-1.38%
jan 1, 1987
37.84
-1.638
-4.15%
jan 1, 1988
39.499
+1.659
4.38%
jan 1, 1989
40.177
+0.678
1.72%
jan 1, 1990
39.008
-1.169
-2.91%
jan 1, 1991
35.469
-3.539
-9.07%
jan 1, 1992
36.091
+0.622
1.75%
jan 1, 1993
37.241
+1.15
3.19%
jan 1, 1994
36.799
-0.442
-1.19%
jan 1, 1995
40.592
+3.793
10.31%
jan 1, 1996
38.774
-1.818
-4.48%
jan 1, 1997
37.169
-1.605
-4.14%
jan 1, 1998
37.663
+0.494
1.33%
jan 1, 1999
37.738
+0.075
0.2%
jan 1, 2000
38.416
+0.679
1.8%
jan 1, 2001
38.136
-0.28
-0.73%
jan 1, 2002
34.812
-3.324
-8.72%
jan 1, 2003
34.629
-0.183
-0.53%
jan 1, 2004
36.149
+1.52
4.39%
jan 1, 2005
36.241
+0.092
0.25%
jan 1, 2006
33.695
-2.546
-7.03%
jan 1, 2007
34.478
+0.783
2.32%
jan 1, 2008
33.591
-0.887
-2.57%
jan 1, 2009
34.809
+1.218
3.63%
jan 1, 2010
34.057
-0.753
-2.16%
jan 1, 2011
34.356
+0.299
0.88%
jan 1, 2012
36.399
+2.043
5.95%
jan 1, 2013
38.356
+1.956
5.37%
jan 1, 2014
38.084
-0.272
-0.71%
jan 1, 2015
37.836
-0.248
-0.65%
Ranking of countries by current statistics by years


Comments: