29
/
en
AIzaSyAYiBZKx7MnpbEhh9jyipgxe19OcubqV5w
April 1, 2024
75731
Azerbaijan
AZE
true
2
1
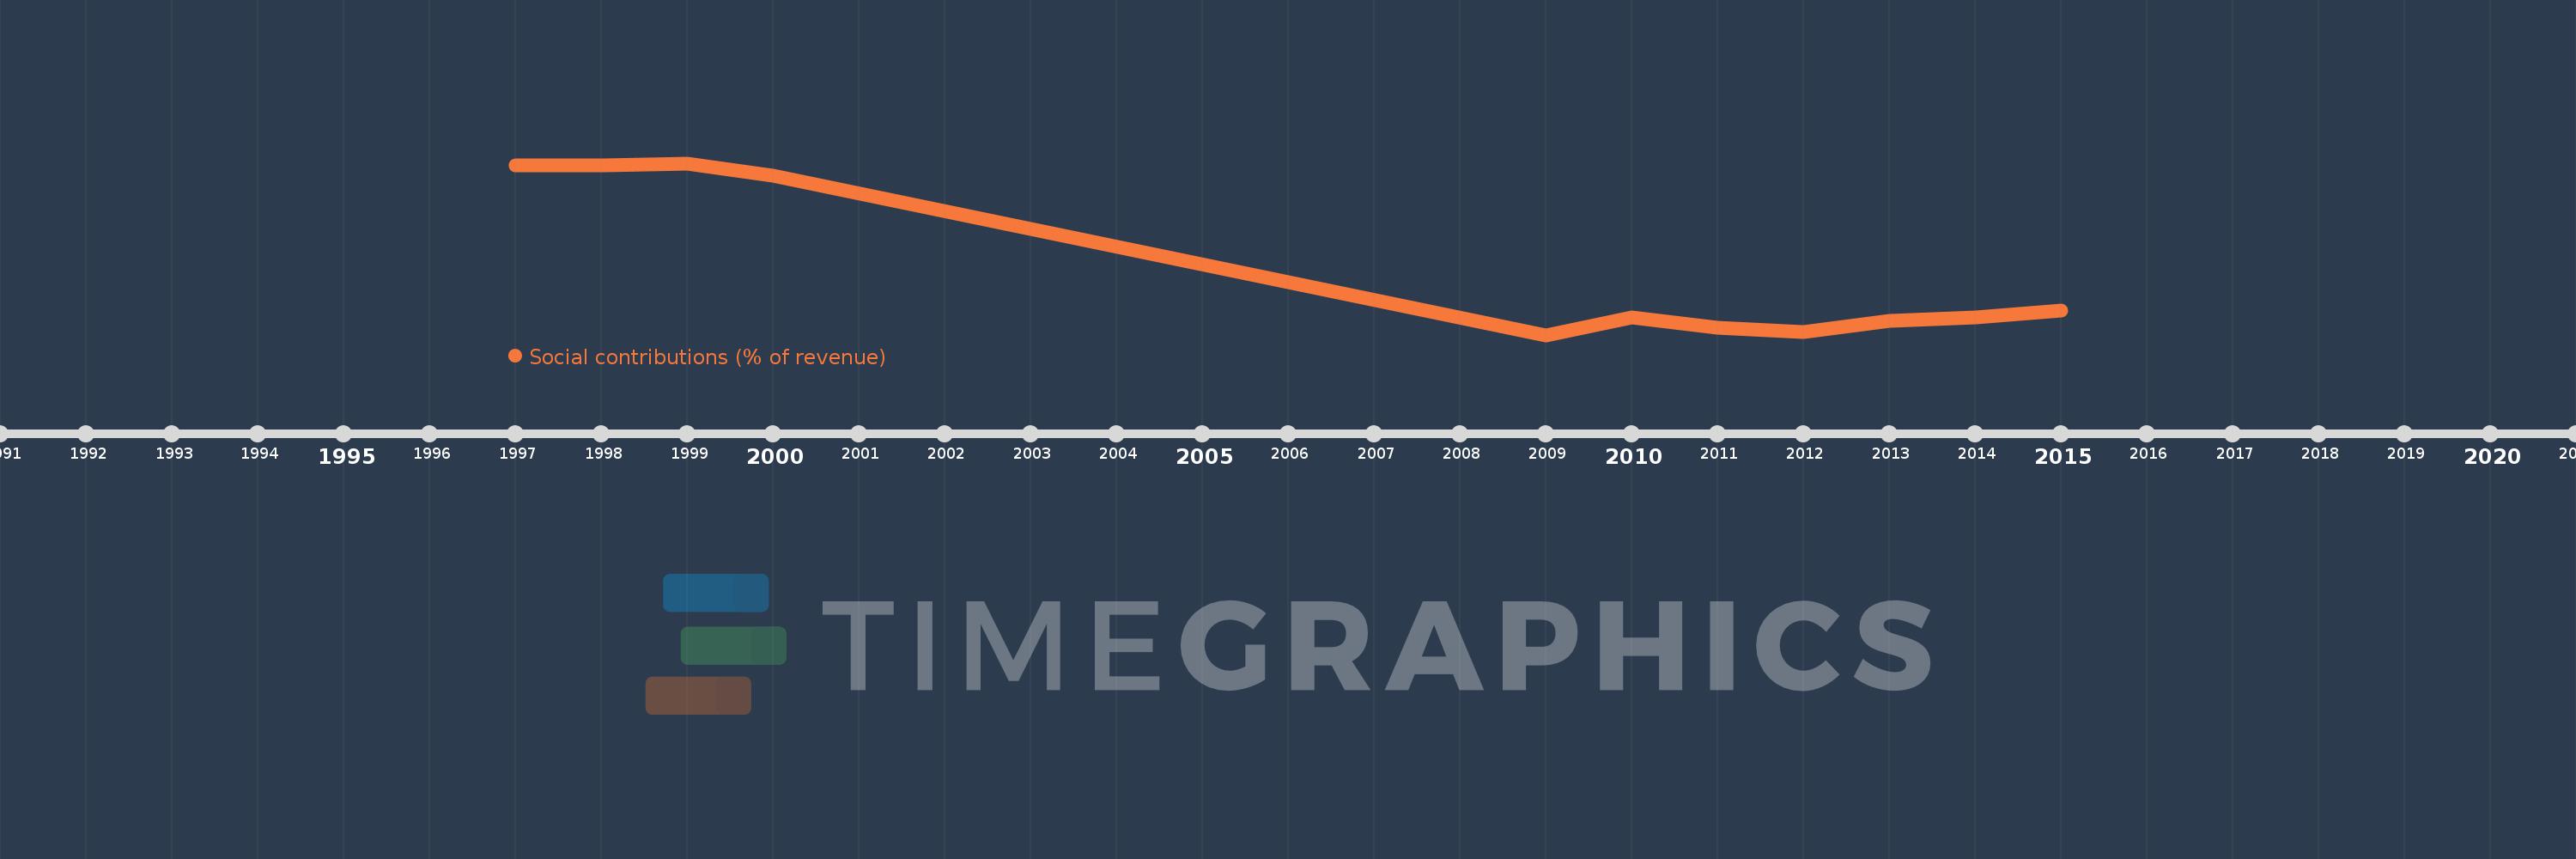
Social contributions (% of revenue)
2015,2014,2013,2012,2011,2010,2009,2000,1999,1998,1997
This statistics in other country:
Timeline:
This timeline shows a graph from 1997 to 2015 of Azerbaijan. No data until 1996. Number of actual observations by date: 11.
Source name:
World Development Indicators
Source organization:
International Monetary Fund, Government Finance Statistics Yearbook and data files.
Categories, topics:
Public Sector
Last updated:
apr 23, 2017
Indicators value changes by year
Maximum:
23.033
jan 1, 1999
At the date of observation
Value
Absolute change
Change from previous value
jan 1, 1997
22.792
+22.792
0.0%
jan 1, 1998
22.848
+0.056
0.25%
jan 1, 1999
23.033
+0.185
0.81%
jan 1, 2000
21.685
-1.348
-5.85%
jan 1, 2009
4.828
-16.858
-77.74%
jan 1, 2010
6.649
+1.821
37.73%
jan 1, 2011
5.58
-1.068
-16.07%
jan 1, 2012
5.178
-0.403
-7.22%
jan 1, 2013
6.292
+1.115
21.53%
jan 1, 2014
6.739
+0.446
7.09%
jan 1, 2015
7.406
+0.668
9.91%
Ranking of countries by current statistics by years


Comments: