29
/
en
AIzaSyAYiBZKx7MnpbEhh9jyipgxe19OcubqV5w
April 1, 2024
182574
Luxembourg
LUX
true
2
1
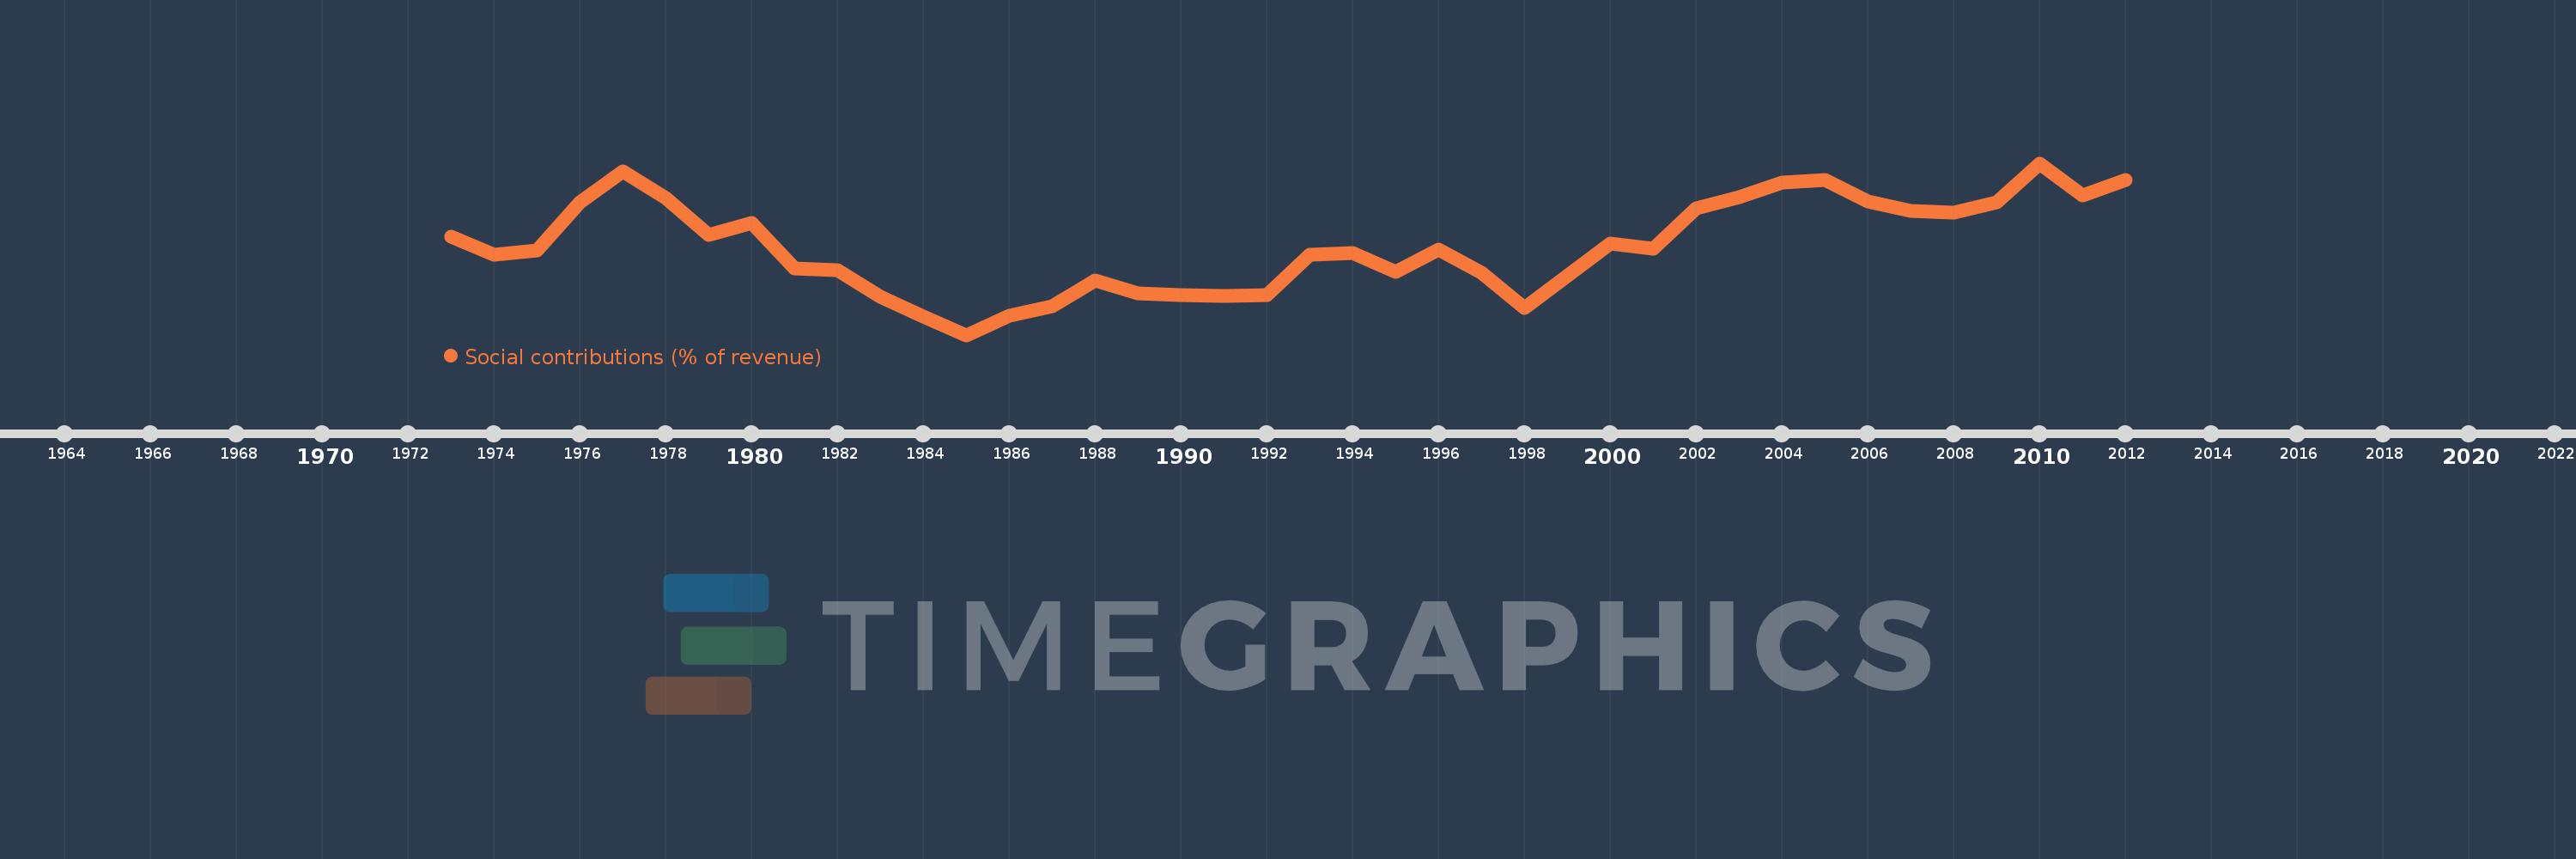
Social contributions (% of revenue)
2012,2011,2010,2009,2008,2007,2006,2005,2004,2003,2002,2001,2000,1998,1997,1996,1995,1994,1993,1992,1991,1990,1989,1988,1987,1986,1985,1984,1983,1982,1981,1980,1979,1978,1977,1976,1975,1974,1973
This statistics in other country:
Timeline:
This timeline shows a graph from 1973 to 2012 of Luxembourg. No data until 1972. Number of actual observations by date: 39.
Source name:
World Development Indicators
Source organization:
International Monetary Fund, Government Finance Statistics Yearbook and data files.
Categories, topics:
Public Sector
Last updated:
apr 23, 2017
Indicators value changes by year
Minimum:
22.939
jan 1, 1985
Maximum:
30.746
jan 1, 2010
At the date of observation
Value
Absolute change
Change from previous value
jan 1, 1973
27.395
+27.395
0.0%
jan 1, 1974
26.588
-0.808
-2.95%
jan 1, 1975
26.773
+0.185
0.7%
jan 1, 1976
28.986
+2.213
8.27%
jan 1, 1977
30.366
+1.381
4.76%
jan 1, 1978
29.177
-1.189
-3.92%
jan 1, 1979
27.481
-1.696
-5.81%
jan 1, 1980
28.014
+0.533
1.94%
jan 1, 1981
25.967
-2.047
-7.31%
jan 1, 1982
25.879
-0.088
-0.34%
jan 1, 1983
24.689
-1.189
-4.59%
jan 1, 1984
23.786
-0.904
-3.66%
jan 1, 1985
22.939
-0.847
-3.56%
jan 1, 1986
23.809
+0.871
3.8%
jan 1, 1987
24.264
+0.455
1.91%
jan 1, 1988
25.423
+1.159
4.77%
jan 1, 1989
24.835
-0.587
-2.31%
jan 1, 1990
24.742
-0.093
-0.38%
jan 1, 1991
24.707
-0.035
-0.14%
jan 1, 1992
24.748
+0.041
0.17%
jan 1, 1993
26.603
+1.855
7.49%
jan 1, 1994
26.678
+0.075
0.28%
jan 1, 1995
25.816
-0.862
-3.23%
jan 1, 1996
26.823
+1.006
3.9%
jan 1, 1997
25.755
-1.067
-3.98%
jan 1, 1998
24.158
-1.597
-6.2%
jan 1, 2000
27.085
+2.927
12.11%
jan 1, 2001
26.855
-0.229
-0.85%
jan 1, 2002
28.7
+1.844
6.87%
jan 1, 2003
29.21
+0.511
1.78%
jan 1, 2004
29.872
+0.662
2.27%
jan 1, 2005
29.997
+0.125
0.42%
jan 1, 2006
29.025
-0.972
-3.24%
jan 1, 2007
28.587
-0.438
-1.51%
jan 1, 2008
28.492
-0.095
-0.33%
jan 1, 2009
28.982
+0.49
1.72%
jan 1, 2010
30.746
+1.764
6.09%
jan 1, 2011
29.292
-1.454
-4.73%
jan 1, 2012
29.977
+0.686
2.34%
Ranking of countries by current statistics by years


Comments: