29
/
en
AIzaSyAYiBZKx7MnpbEhh9jyipgxe19OcubqV5w
April 1, 2024
65453
Albania
ALB
true
2
1
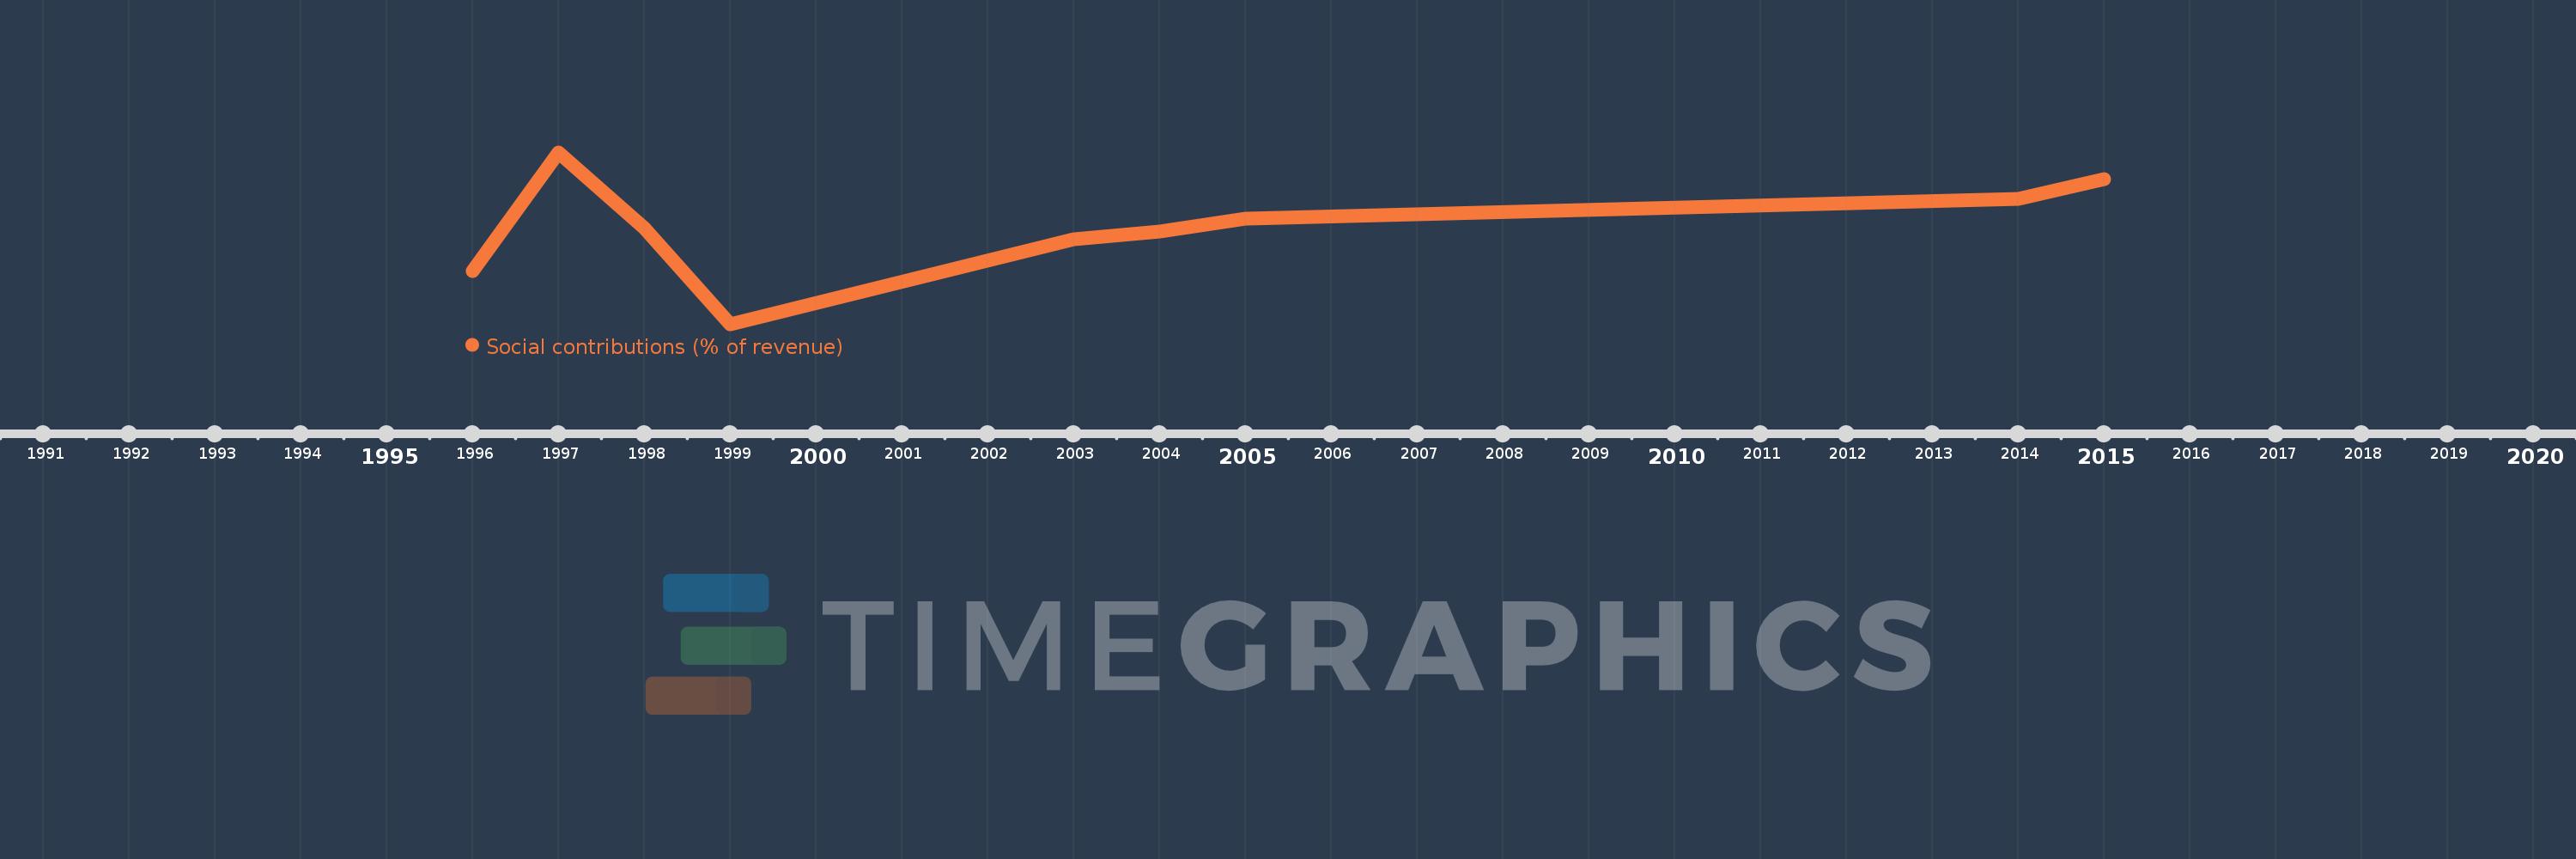
Social contributions (% of revenue)
2015,2014,2005,2004,2003,1999,1998,1997,1996
This statistics in other country:
Timeline:
This timeline shows a graph from 1996 to 2015 of Albania. No data until 1995. Number of actual observations by date: 9.
Source name:
World Development Indicators
Source organization:
International Monetary Fund, Government Finance Statistics Yearbook and data files.
Categories, topics:
Public Sector
Last updated:
apr 23, 2017
Indicators value changes by year
Minimum:
12.421
jan 1, 1999
Maximum:
20.766
jan 1, 1997
At the date of observation
Value
Absolute change
Change from previous value
jan 1, 1996
15.002
+15.002
0.0%
jan 1, 1997
20.766
+5.764
38.42%
jan 1, 1998
17.075
-3.691
-17.78%
jan 1, 1999
12.421
-4.653
-27.25%
jan 1, 2003
16.556
+4.134
33.28%
jan 1, 2004
16.936
+0.38
2.3%
jan 1, 2005
17.554
+0.618
3.65%
jan 1, 2014
18.527
+0.972
5.54%
jan 1, 2015
19.459
+0.932
5.03%
Ranking of countries by current statistics by years


Comments: