29
/
en
AIzaSyAYiBZKx7MnpbEhh9jyipgxe19OcubqV5w
April 1, 2024
118448
Czech Republic
CZE
true
2
1
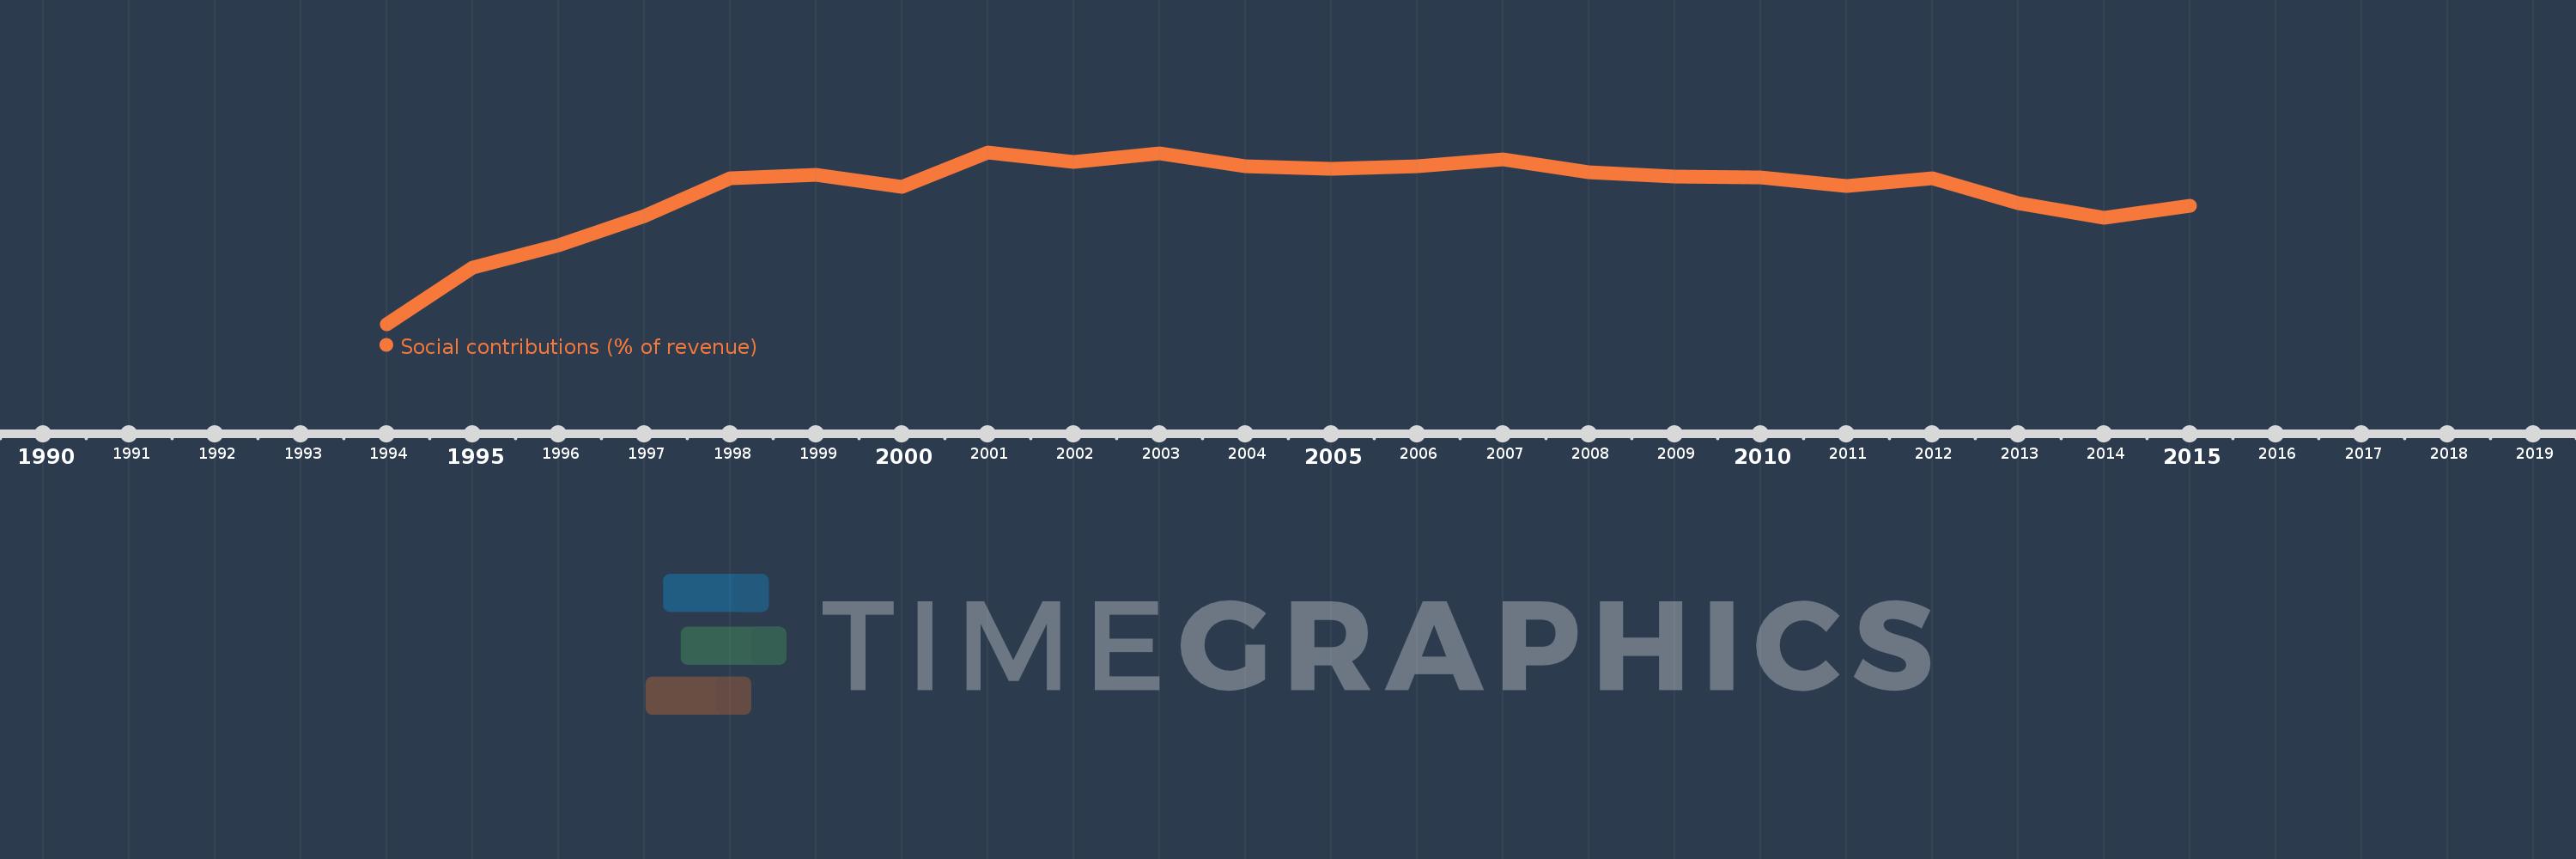
Social contributions (% of revenue)
2015,2014,2013,2012,2011,2010,2009,2008,2007,2006,2005,2004,2003,2002,2001,2000,1999,1998,1997,1996,1995,1994
This statistics in other country:
Timeline:
This timeline shows a graph from 1994 to 2015 of Czech Republic. No data until 1993. Number of actual observations by date: 22.
Source name:
World Development Indicators
Source organization:
International Monetary Fund, Government Finance Statistics Yearbook and data files.
Categories, topics:
Public Sector
Last updated:
apr 23, 2017
Indicators value changes by year
Minimum:
34.945
jan 1, 1994
Maximum:
46.511
jan 1, 2001
At the date of observation
Value
Absolute change
Change from previous value
jan 1, 1994
34.945
+34.945
0.0%
jan 1, 1995
38.754
+3.81
10.9%
jan 1, 1996
40.241
+1.487
3.84%
jan 1, 1997
42.215
+1.974
4.91%
jan 1, 1998
44.743
+2.528
5.99%
jan 1, 1999
44.994
+0.251
0.56%
jan 1, 2000
44.202
-0.792
-1.76%
jan 1, 2001
46.511
+2.31
5.23%
jan 1, 2002
45.859
-0.652
-1.4%
jan 1, 2003
46.444
+0.585
1.28%
jan 1, 2004
45.595
-0.849
-1.83%
jan 1, 2005
45.43
-0.165
-0.36%
jan 1, 2006
45.608
+0.177
0.39%
jan 1, 2007
46.047
+0.439
0.96%
jan 1, 2008
45.173
-0.874
-1.9%
jan 1, 2009
44.906
-0.268
-0.59%
jan 1, 2010
44.853
-0.053
-0.12%
jan 1, 2011
44.241
-0.612
-1.36%
jan 1, 2012
44.785
+0.544
1.23%
jan 1, 2013
43.095
-1.689
-3.77%
jan 1, 2014
42.127
-0.968
-2.25%
jan 1, 2015
42.925
+0.798
1.89%
Ranking of countries by current statistics by years


Comments: