29
/
en
AIzaSyAYiBZKx7MnpbEhh9jyipgxe19OcubqV5w
April 1, 2024
31148
Europe & Central Asia
ECS
false
2
1
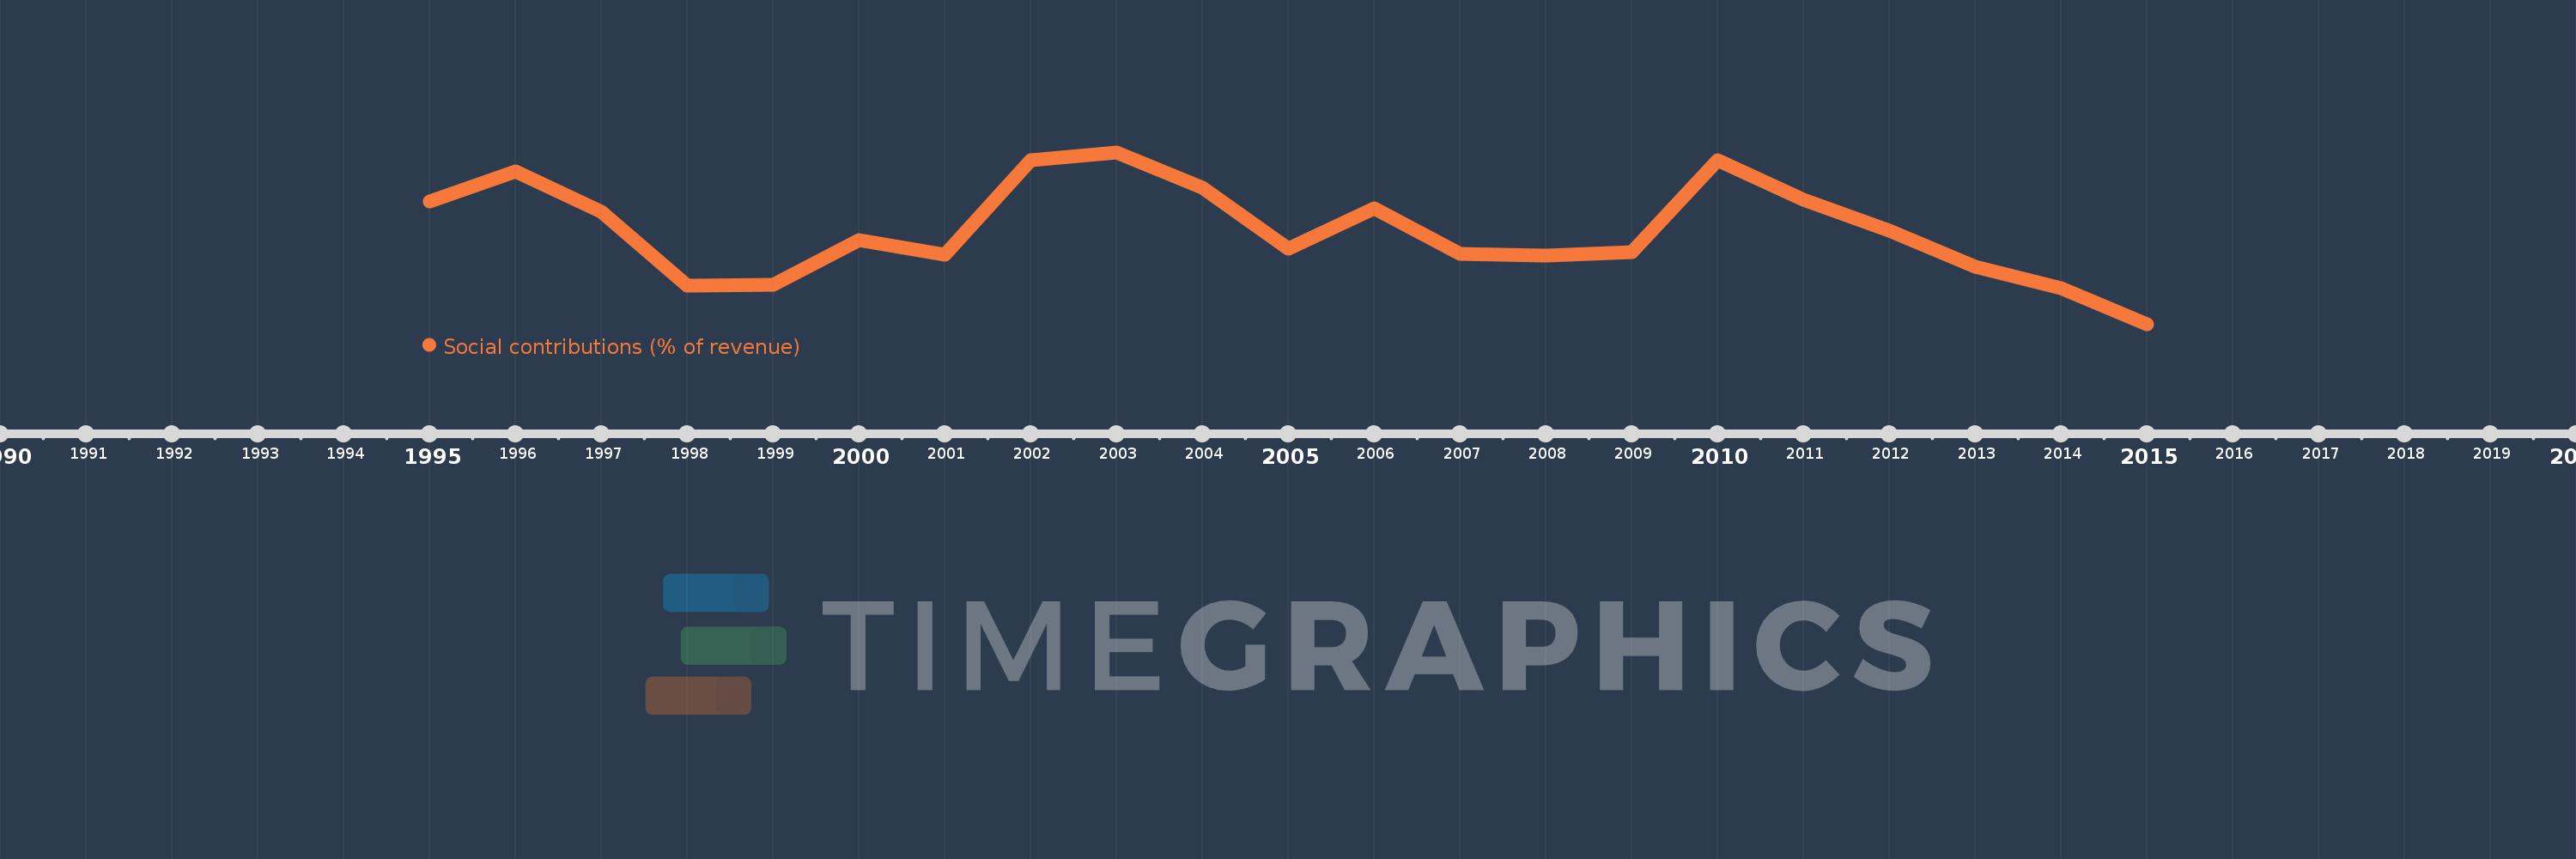
Social contributions (% of revenue)
2015,2014,2013,2012,2011,2010,2009,2008,2007,2006,2005,2004,2003,2002,2001,2000,1999,1998,1997,1996,1995
This statistics in other country:
Timeline:
This timeline shows a graph from 1995 to 2015 of Europe & Central Asia. No data until 1994. Number of actual observations by date: 21.
Source name:
World Development Indicators
Source organization:
International Monetary Fund, Government Finance Statistics Yearbook and data files.
Categories, topics:
Public Sector
Last updated:
apr 23, 2017
Indicators value changes by year
Minimum:
29.819
jan 1, 2015
Maximum:
33.428
jan 1, 2003
At the date of observation
Value
Absolute change
Change from previous value
jan 1, 1995
32.406
+32.406
0.0%
jan 1, 1996
33.034
+0.628
1.94%
jan 1, 1997
32.181
-0.853
-2.58%
jan 1, 1998
30.637
-1.544
-4.8%
jan 1, 1999
30.647
+0.009
0.03%
jan 1, 2000
31.589
+0.943
3.08%
jan 1, 2001
31.278
-0.312
-0.99%
jan 1, 2002
33.257
+1.979
6.33%
jan 1, 2003
33.428
+0.171
0.52%
jan 1, 2004
32.695
-0.734
-2.2%
jan 1, 2005
31.399
-1.295
-3.96%
jan 1, 2006
32.25
+0.85
2.71%
jan 1, 2007
31.304
-0.946
-2.93%
jan 1, 2008
31.258
-0.046
-0.15%
jan 1, 2009
31.34
+0.082
0.26%
jan 1, 2010
33.257
+1.917
6.12%
jan 1, 2011
32.441
-0.815
-2.45%
jan 1, 2012
31.777
-0.665
-2.05%
jan 1, 2013
31.032
-0.744
-2.34%
jan 1, 2014
30.567
-0.465
-1.5%
jan 1, 2015
29.819
-0.748
-2.45%
Ranking of countries by current statistics by years


Comments: