29
/
en
AIzaSyAYiBZKx7MnpbEhh9jyipgxe19OcubqV5w
April 1, 2024
194946
Mauritius
MUS
true
2
1
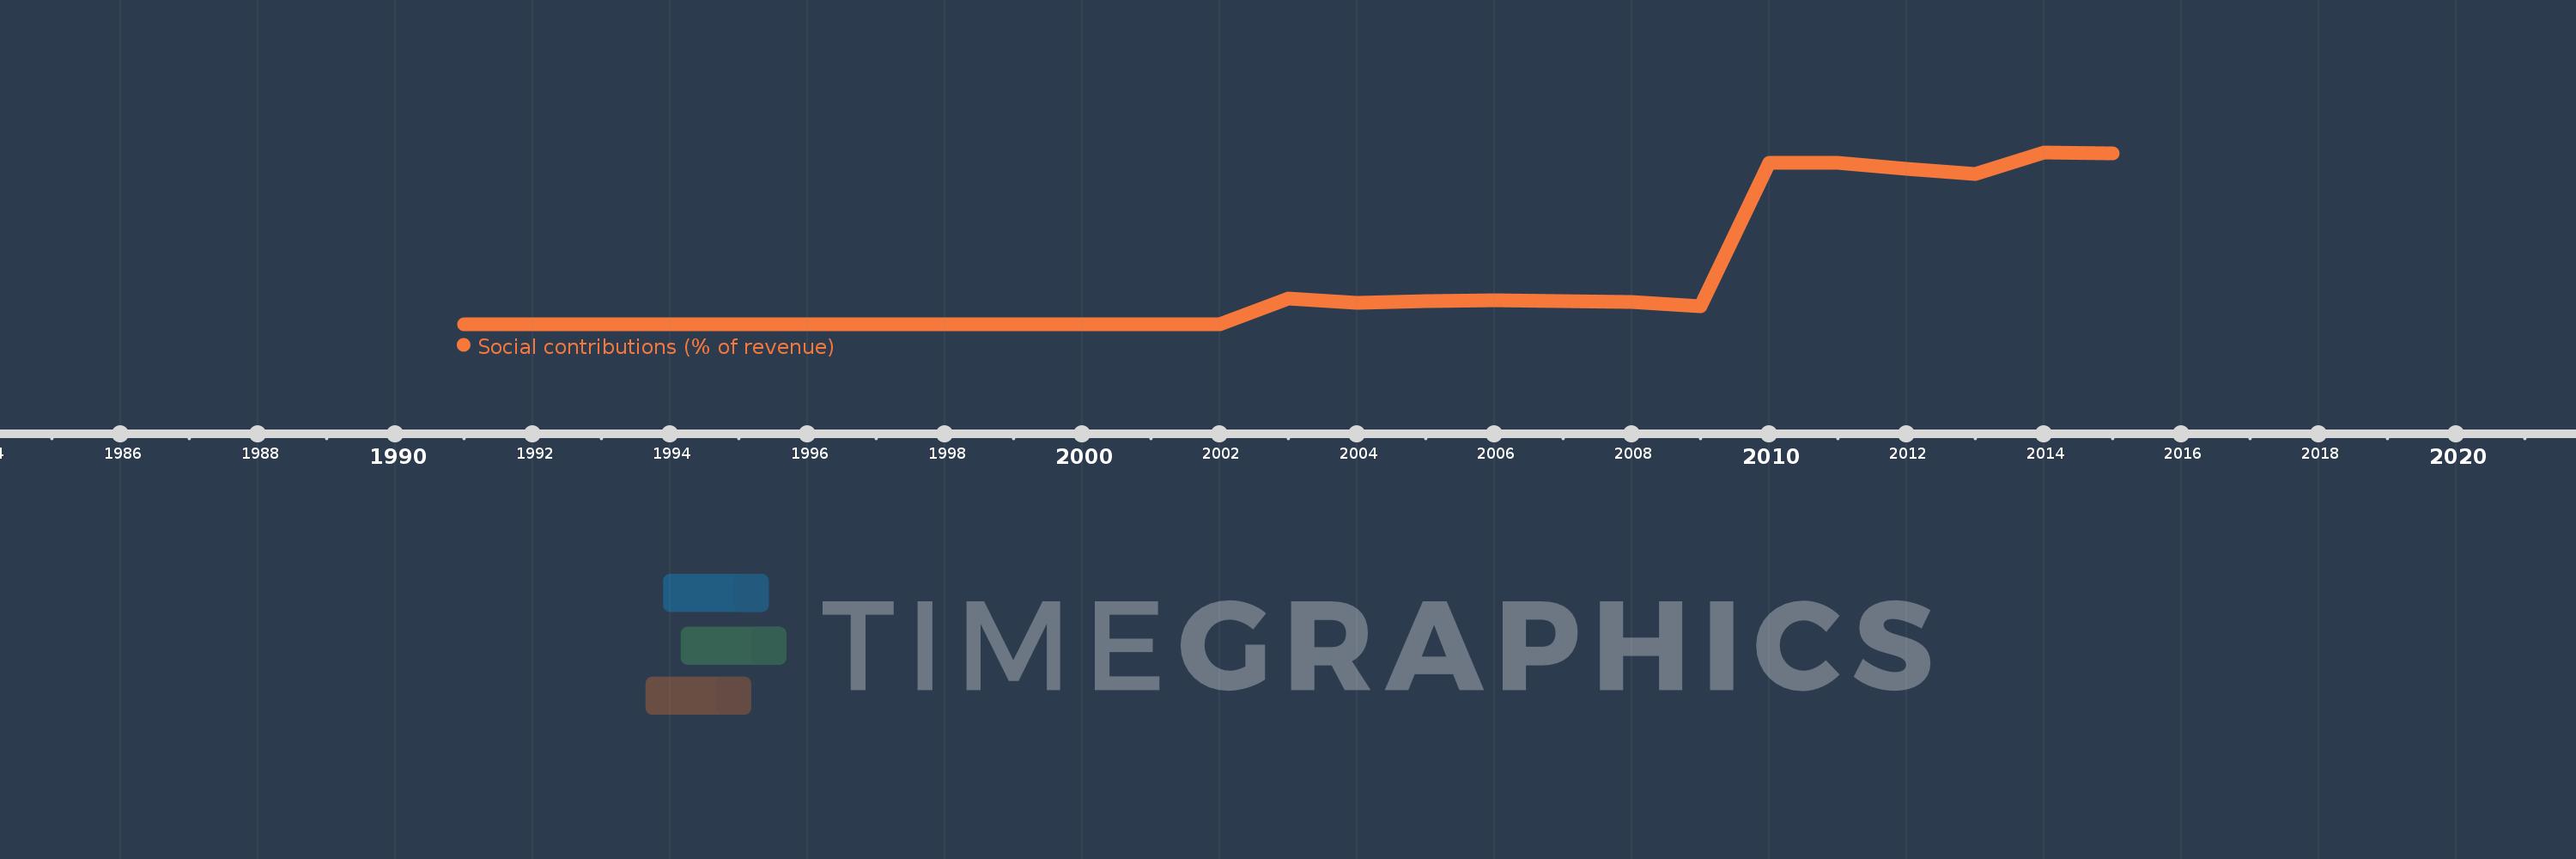
Social contributions (% of revenue)
2015,2014,2013,2012,2011,2010,2009,2008,2007,2006,2005,2004,2003,2002,2001,2000,1999,1998,1997,1996,1995,1994,1993,1992,1991
This statistics in other country:
Timeline:
This timeline shows a graph from 1991 to 2015 of Mauritius. No data until 1990. Number of actual observations by date: 25.
Source name:
World Development Indicators
Source organization:
International Monetary Fund, Government Finance Statistics Yearbook and data files.
Categories, topics:
Public Sector
Last updated:
apr 23, 2017
Indicators value changes by year
At the date of observation
Value
Absolute change
Change from previous value
jan 1, 1991
0.005
+0.005
0.0%
jan 1, 1992
0.004
-0.001
-11.75%
jan 1, 1993
0.005
+0.001
13.65%
jan 1, 1994
0.004
0.0
-7.09%
jan 1, 1995
0.005
+0.001
22.85%
jan 1, 1996
0.005
0.0
-1.17%
jan 1, 1997
0.006
+0.0
2.32%
jan 1, 1998
0.005
-0.001
-11.05%
jan 1, 1999
0.005
+0.001
11.27%
jan 1, 2000
0.005
-0.001
-11.19%
jan 1, 2001
0.004
0.0
-9.75%
jan 1, 2002
0.009
+0.004
102.47%
jan 1, 2003
0.52
+0.511
5.79K%
jan 1, 2004
0.448
-0.072
-13.85%
jan 1, 2005
0.482
+0.034
7.54%
jan 1, 2006
0.492
+0.01
2.11%
jan 1, 2007
0.476
-0.016
-3.2%
jan 1, 2008
0.454
-0.023
-4.77%
jan 1, 2009
0.37
-0.084
-18.51%
jan 1, 2010
3.294
+2.924
790.91%
jan 1, 2011
3.3
+0.006
0.19%
jan 1, 2012
3.166
-0.135
-4.09%
jan 1, 2013
3.07
-0.095
-3.0%
jan 1, 2014
3.507
+0.437
14.23%
jan 1, 2015
3.492
-0.016
-0.44%
Ranking of countries by current statistics by years


Comments: