29
/
en
AIzaSyAYiBZKx7MnpbEhh9jyipgxe19OcubqV5w
April 1, 2024
103069
Central African Republic
CAF
true
2
1
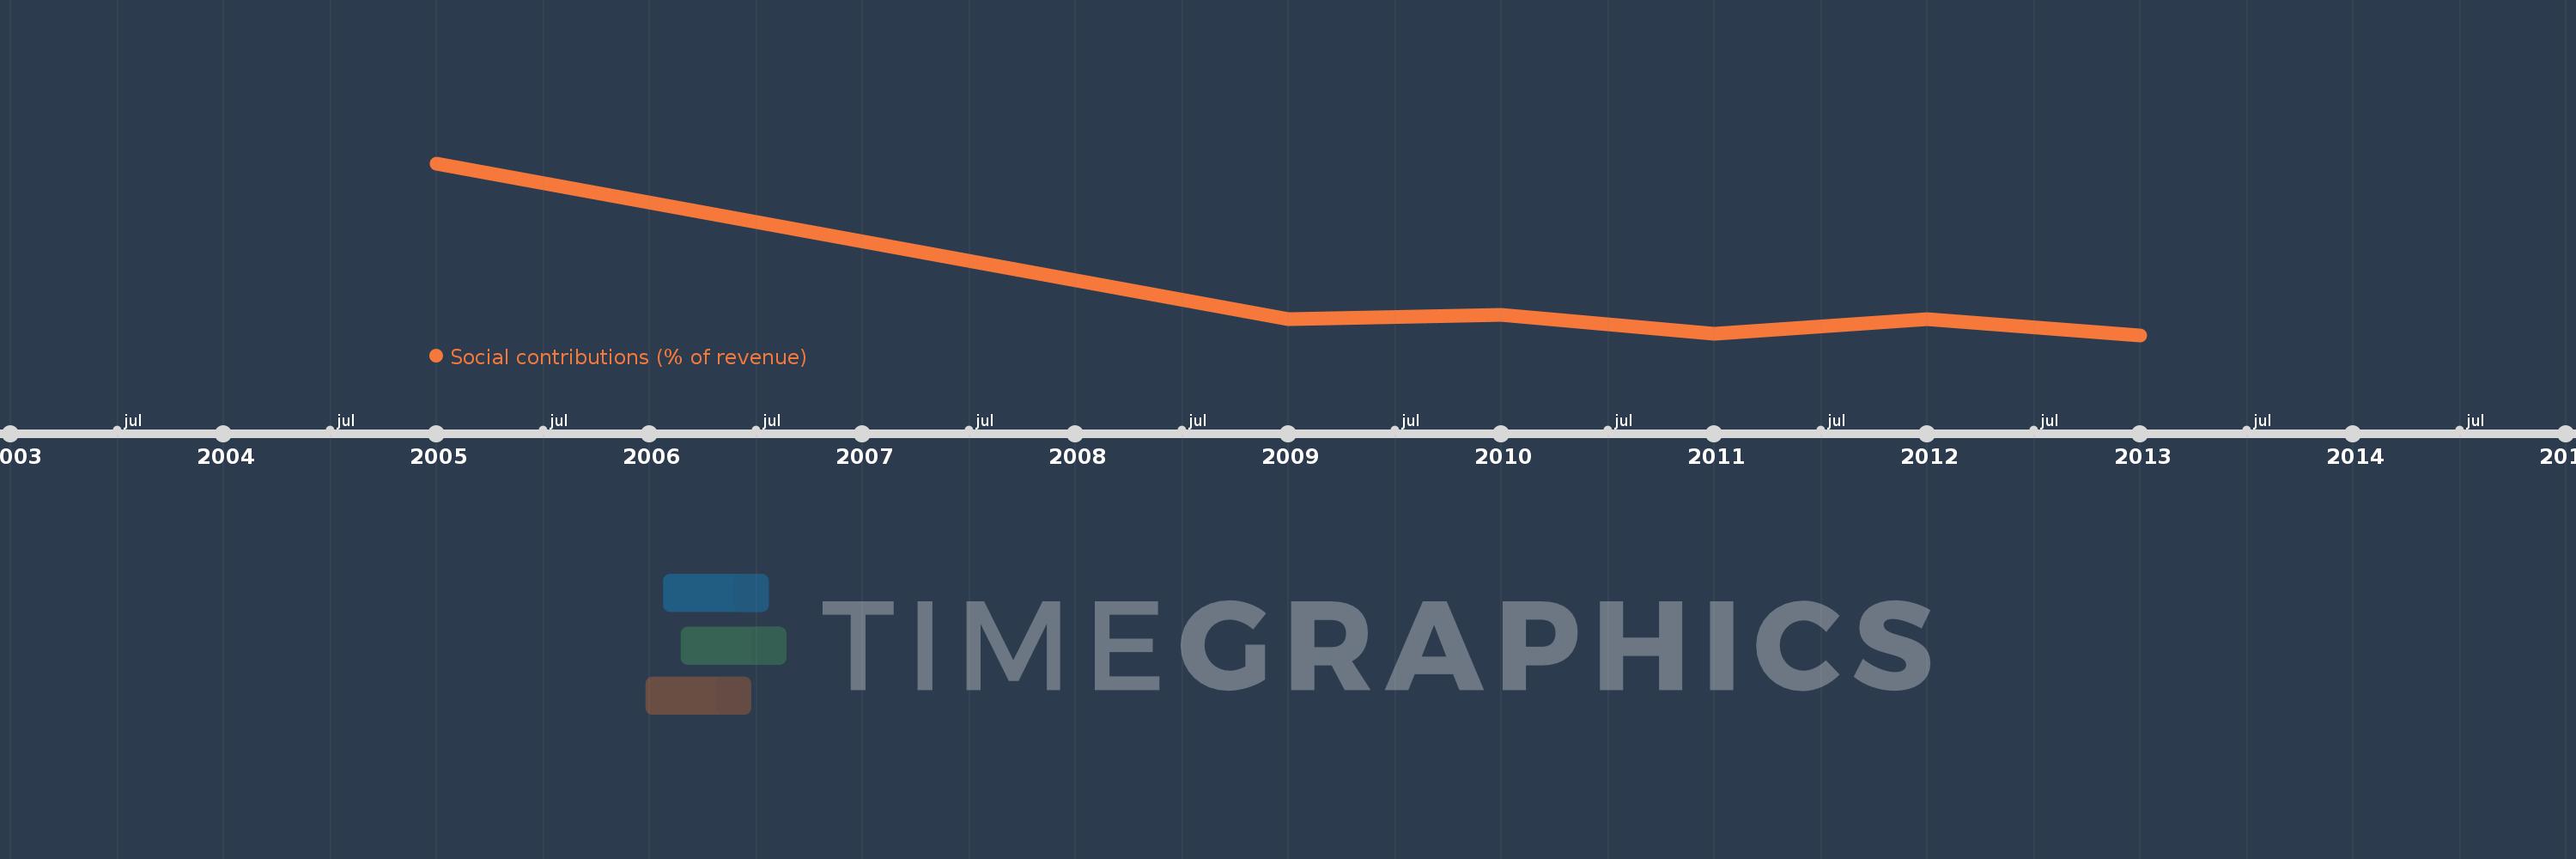
Social contributions (% of revenue)
2013,2012,2011,2010,2009,2005
This statistics in other country:
Timeline:
This timeline shows a graph from 2005 to 2013 of Central African Republic. No data until 2004. Number of actual observations by date: 6.
Source name:
World Development Indicators
Source organization:
International Monetary Fund, Government Finance Statistics Yearbook and data files.
Categories, topics:
Public Sector
Last updated:
apr 23, 2017
Indicators value changes by year
At the date of observation
Value
Absolute change
Change from previous value
jan 1, 2005
6.391
+6.391
0.0%
jan 1, 2009
1.591
-4.8
-75.1%
jan 1, 2010
1.713
+0.122
7.66%
jan 1, 2011
1.142
-0.571
-33.36%
jan 1, 2012
1.585
+0.443
38.83%
jan 1, 2013
1.091
-0.494
-31.19%
Ranking of countries by current statistics by years


Comments: