29
/
en
AIzaSyAYiBZKx7MnpbEhh9jyipgxe19OcubqV5w
April 1, 2024
165566
Jordan
JOR
true
2
1
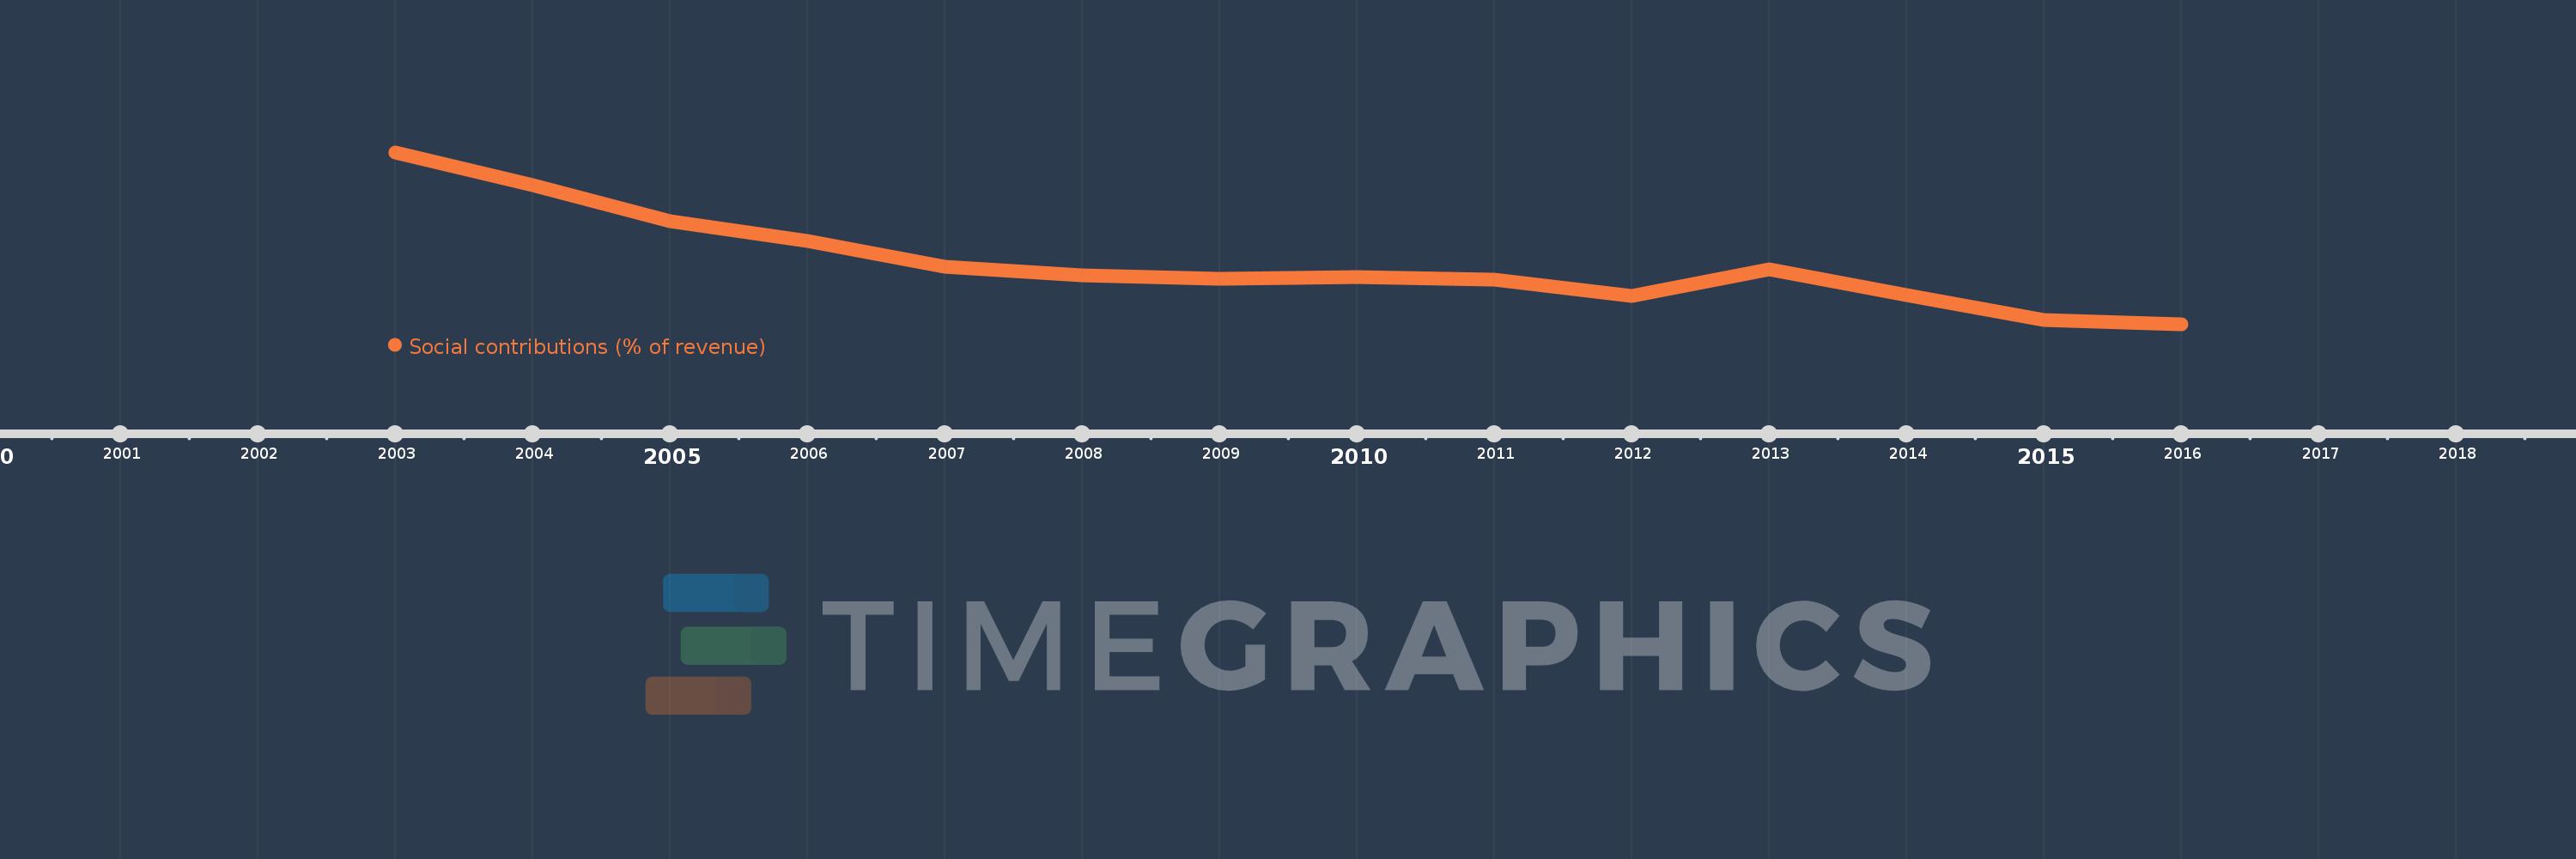
Social contributions (% of revenue)
2016,2015,2014,2013,2012,2011,2010,2009,2008,2007,2006,2005,2004,2003
This statistics in other country:
Timeline:
This timeline shows a graph from 2003 to 2016 of Jordan. No data until 2002. Number of actual observations by date: 14.
Source name:
World Development Indicators
Source organization:
International Monetary Fund, Government Finance Statistics Yearbook and data files.
Categories, topics:
Public Sector
Last updated:
apr 23, 2017
Indicators value changes by year
At the date of observation
Value
Absolute change
Change from previous value
jan 1, 2003
0.926
+0.926
0.0%
jan 1, 2004
0.802
-0.124
-13.43%
jan 1, 2005
0.665
-0.137
-17.03%
jan 1, 2006
0.591
-0.075
-11.23%
jan 1, 2007
0.492
-0.098
-16.65%
jan 1, 2008
0.461
-0.032
-6.41%
jan 1, 2009
0.447
-0.013
-2.9%
jan 1, 2010
0.453
+0.006
1.34%
jan 1, 2011
0.444
-0.009
-2.09%
jan 1, 2012
0.382
-0.062
-13.88%
jan 1, 2013
0.481
+0.098
25.74%
jan 1, 2014
0.384
-0.097
-20.18%
jan 1, 2015
0.289
-0.095
-24.7%
jan 1, 2016
0.274
-0.015
-5.29%
Ranking of countries by current statistics by years


Comments: