29
/
en
AIzaSyAYiBZKx7MnpbEhh9jyipgxe19OcubqV5w
April 1, 2024
256843
Sweden
SWE
true
2
1
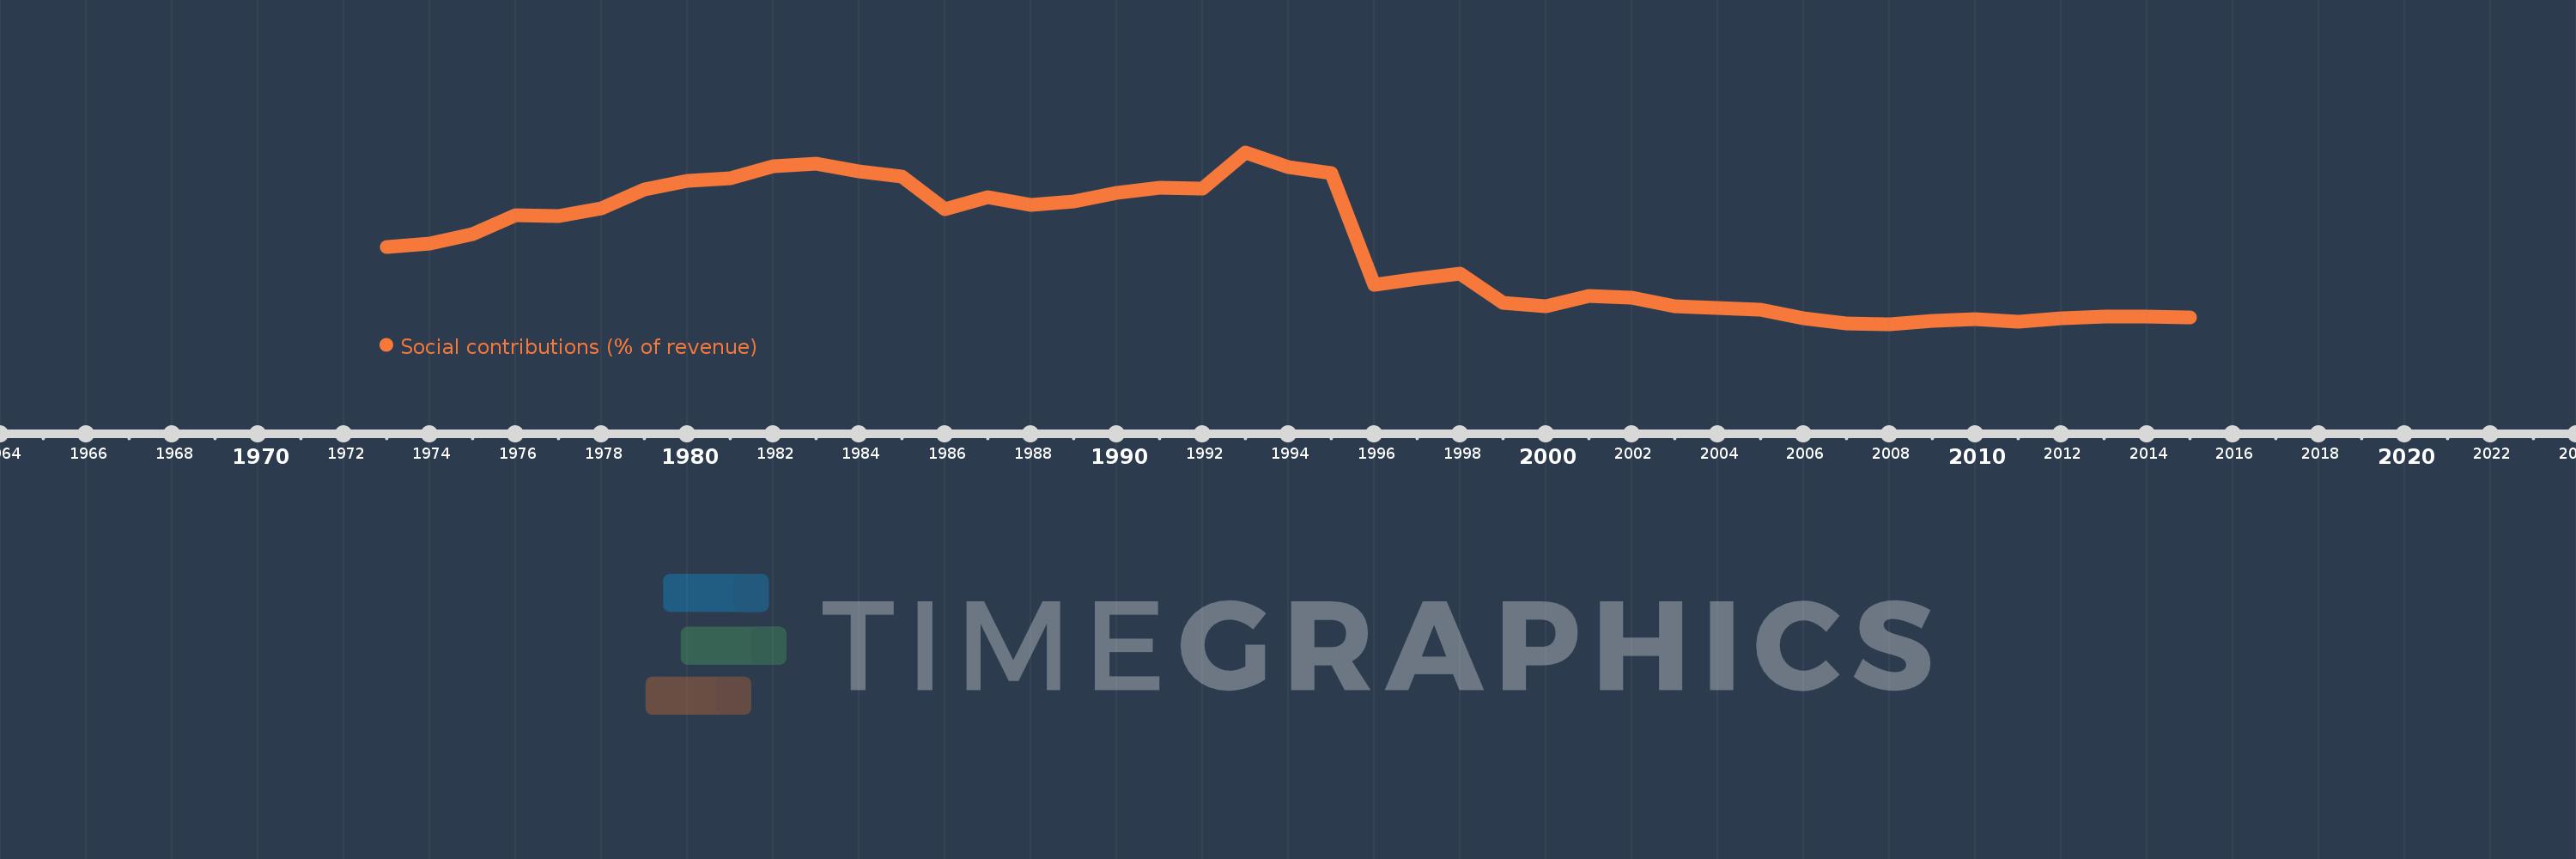
Social contributions (% of revenue)
2015,2014,2013,2012,2011,2010,2009,2008,2007,2006,2005,2004,2003,2002,2001,2000,1999,1998,1997,1996,1995,1994,1993,1992,1991,1990,1989,1988,1987,1986,1985,1984,1983,1982,1981,1980,1979,1978,1977,1976,1975,1974,1973
This statistics in other country:
Timeline:
This timeline shows a graph from 1973 to 2015 of Sweden. No data until 1972. Number of actual observations by date: 43.
Source name:
World Development Indicators
Source organization:
International Monetary Fund, Government Finance Statistics Yearbook and data files.
Categories, topics:
Public Sector
Last updated:
apr 23, 2017
Indicators value changes by year
Maximum:
37.322
jan 1, 1993
At the date of observation
Value
Absolute change
Change from previous value
jan 1, 1973
21.468
+21.468
0.0%
jan 1, 1974
22.057
+0.588
2.74%
jan 1, 1975
23.639
+1.582
7.17%
jan 1, 1976
26.707
+3.069
12.98%
jan 1, 1977
26.611
-0.096
-0.36%
jan 1, 1978
27.882
+1.271
4.78%
jan 1, 1979
31.044
+3.162
11.34%
jan 1, 1980
32.533
+1.489
4.8%
jan 1, 1981
33.012
+0.479
1.47%
jan 1, 1982
34.982
+1.97
5.97%
jan 1, 1983
35.449
+0.467
1.33%
jan 1, 1984
34.094
-1.355
-3.82%
jan 1, 1985
33.309
-0.785
-2.3%
jan 1, 1986
27.799
-5.51
-16.54%
jan 1, 1987
29.81
+2.011
7.23%
jan 1, 1988
28.51
-1.299
-4.36%
jan 1, 1989
29.132
+0.622
2.18%
jan 1, 1990
30.471
+1.338
4.59%
jan 1, 1991
31.408
+0.937
3.08%
jan 1, 1992
31.303
-0.105
-0.33%
jan 1, 1993
37.322
+6.02
19.23%
jan 1, 1994
34.789
-2.534
-6.79%
jan 1, 1995
33.816
-0.973
-2.8%
jan 1, 1996
15.146
-18.67
-55.21%
jan 1, 1997
16.074
+0.928
6.13%
jan 1, 1998
16.904
+0.831
5.17%
jan 1, 1999
11.982
-4.922
-29.12%
jan 1, 2000
11.517
-0.465
-3.88%
jan 1, 2001
13.143
+1.626
14.12%
jan 1, 2002
12.851
-0.292
-2.22%
jan 1, 2003
11.448
-1.403
-10.92%
jan 1, 2004
11.231
-0.217
-1.9%
jan 1, 2005
10.896
-0.335
-2.99%
jan 1, 2006
9.394
-1.502
-13.78%
jan 1, 2007
8.548
-0.846
-9.0%
jan 1, 2008
8.459
-0.089
-1.04%
jan 1, 2009
9.033
+0.574
6.78%
jan 1, 2010
9.302
+0.27
2.98%
jan 1, 2011
8.943
-0.359
-3.86%
jan 1, 2012
9.4
+0.457
5.11%
jan 1, 2013
9.686
+0.286
3.05%
jan 1, 2014
9.676
-0.01
-0.11%
jan 1, 2015
9.665
-0.011
-0.11%
Ranking of countries by current statistics by years


Comments: