29
/
en
AIzaSyAYiBZKx7MnpbEhh9jyipgxe19OcubqV5w
April 1, 2024
152041
Hong Kong SAR, China
HKG
true
2
1
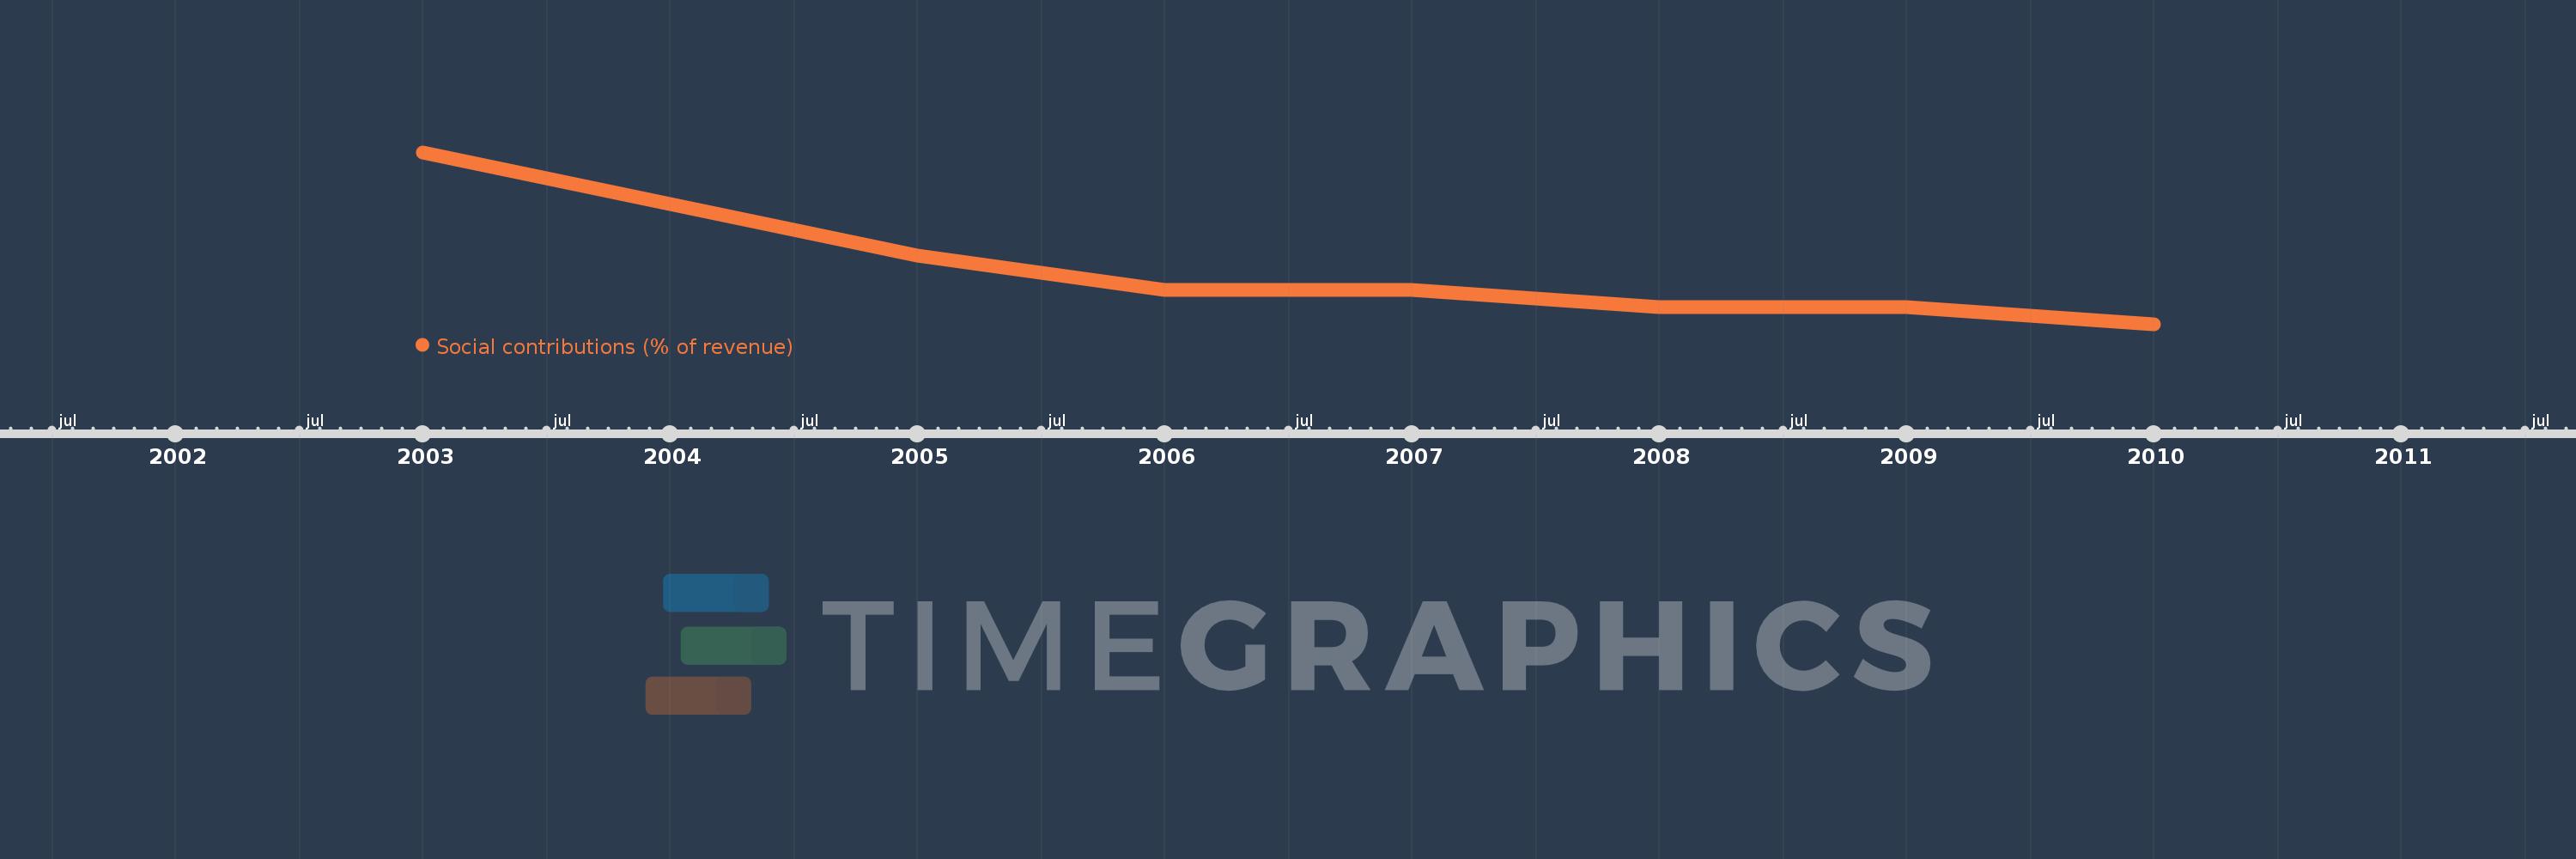
Social contributions (% of revenue)
2010,2009,2008,2007,2006,2005,2004,2003
This statistics in other country:
Timeline:
This timeline shows a graph from 2003 to 2010 of Hong Kong SAR, China. No data until 2002. Number of actual observations by date: 8.
Source name:
World Development Indicators
Source organization:
International Monetary Fund, Government Finance Statistics Yearbook and data files.
Categories, topics:
Public Sector
Last updated:
apr 23, 2017
Indicators value changes by year
At the date of observation
Value
Absolute change
Change from previous value
jan 1, 2003
0.014
+0.014
0.0%
jan 1, 2004
0.011
-0.002
-17.51%
jan 1, 2005
0.008
-0.003
-27.93%
jan 1, 2006
0.006
-0.002
-19.93%
jan 1, 2007
0.006
-0.001
-14.29%
jan 1, 2008
0.005
-0.001
-17.08%
jan 1, 2009
0.005
+0.0
4.93%
jan 1, 2010
0.004
-0.001
-13.93%
Ranking of countries by current statistics by years


Comments: